
While the 'easy gains' in risk-sensitive currencies seem to have already been made, the overall outlook for risk to stay supported is the most constructive seen since late July as the analysis of the currency strength model conducted in today's note aims to demonstrate.
Quick Take
As the short-term angst that used to radiate out of the US-China trade war, Brexit, Italian politics or HK protests continues to dissipate, the likes of the AUD, NZD, CAD keep finding mounting buying interest, with the contrast clearly visible in the underperformance of the JPY and CHF markets. In a week where the ECB will take center stage, the effects on the back of the synchronized quadfecta of positive news for risks are still reverberating around financial markets as key stock indices also confirm key breakouts. While the 'easy gains' in risk-sensitive currencies seem to have already been made, the overall outlook for risk to stay supported is the most constructive seen since late July as the analysis of the currency strength model conducted in today's note aims to demonstrate. The 'risk-on' train is in full motion.
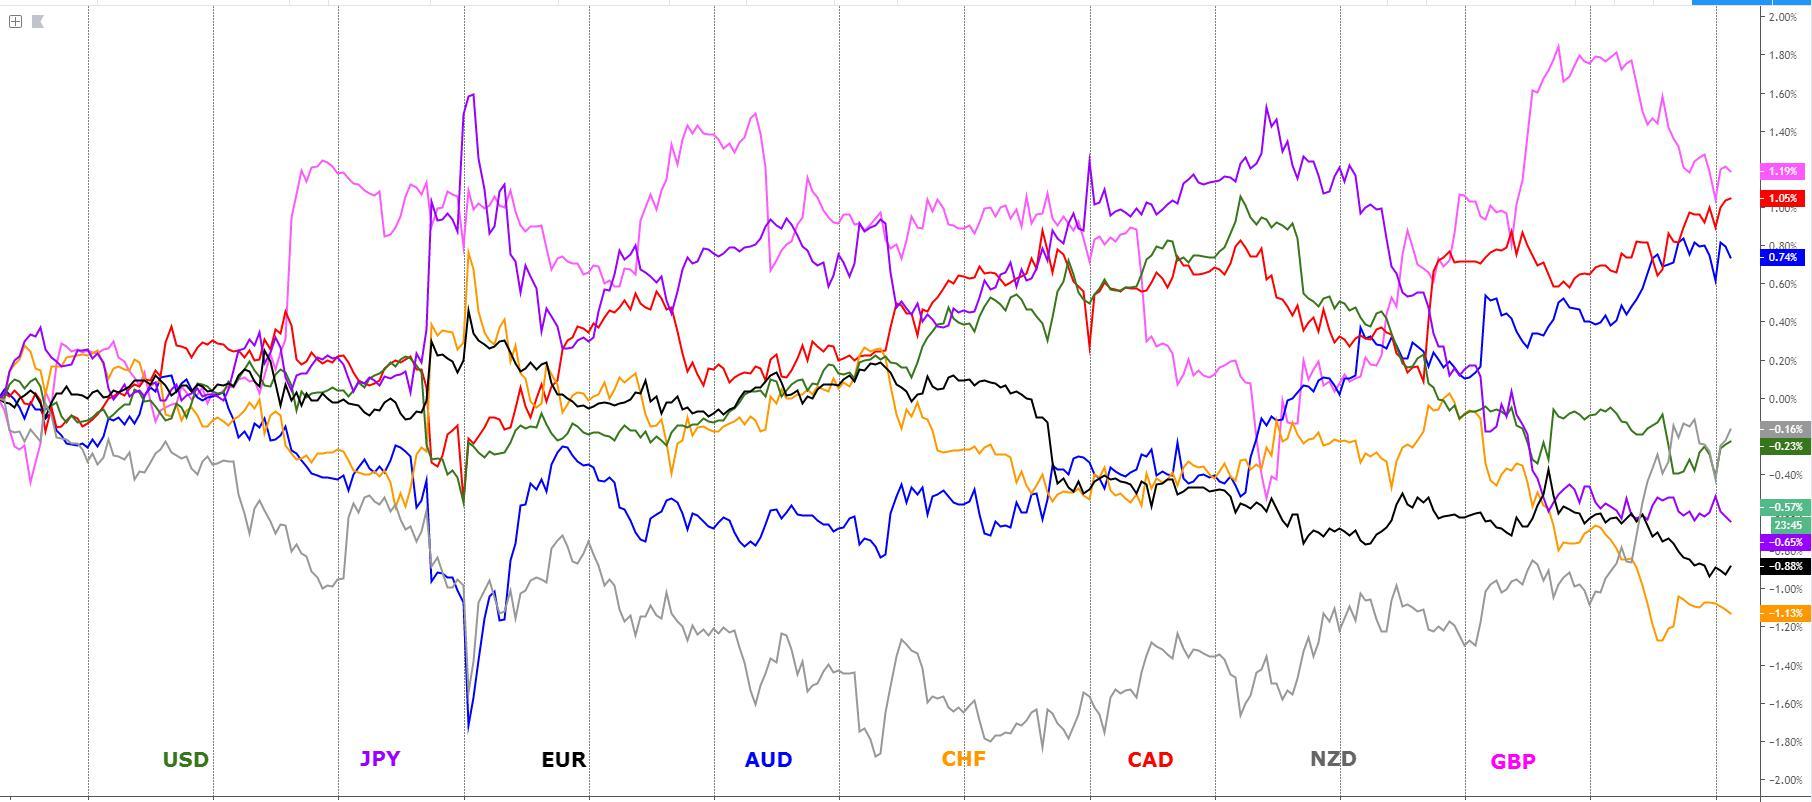
The indices show the performance of a particular currency vs G8 FX. An educational article about how to build your own currency meter can be found in the Global Prime's Research section.
Narratives In Financial Markets
* The Information is gathered after scanning top publications including the FT, WSJ, Reuters, Bloomberg, ForexLive, Institutional Bank Research reports.
US NFP not as bad as the headline implies: The US NFP headline number disappointed with a print of 130k vs 160k expected, including a 20k downward revision to June and July. As part of my note to clients on Friday, I mentioned that August tends to be a miss in the NFP if history in this century is any indication. I mentioned that “if we look at the past 22 years as a sample of data large enough, the August jobs report has been missing its expectations nearly 80% of the time, with an average miss of -48K.” That said, the fall in the USD was limited as there were some bright spots such as the steadily low unemployment rate of 3.7%, which combined with a tick up in the participation rate to 63.2% vs 63.0% prior, and average hourly earnings up at +0.4% vs +0.3% exp, offset the miss in the headline number.
Fed's Powell in no rush to go for a 50bp rate cut: Fed’s Chairman Powell, in a speech in Switzerland, showed a lack of pre-commitment to telegraph the prospects of a bold 50bp rate cut during Sept, with the market dialing back even the chances of a -25bps from an outcome fully priced to now stand at 91%. Note, the market now officially enters the blackout period with no further intervention by Fed members allowed. Powell said that “the most likely outlook for our economy remains a favourable one with moderate growth, a strong labour market and inflation moving back up close to our 2% goal” but the caveat of “significant risks” was introduced, “we’ve been monitoring those, including slowing global growth, uncertainty around trade policy, and also persistently low inflation.”
'Risk on' firmly in place: We are headed into a new week of trading, in which the ECB monetary policy meeting will command the most interest by the market, with risk appetite still firmly in place. The eagle view one can obtain by scanning risk-sensitive assets reveals ‘risk on’ dynamics remain in place as reflected by the breakout in major stock indices, including the S&P 500, the decisive sell-off in the Japanese Yen, the Swiss Franc of Gold. The renewed strength in the Yuan in line with the strong appreciation in EM FX is also assisting the sense of relaxed risk sentiment. The fixed-income market (United States 30-Year bond yield) is the only market not quite taking off just yet. Overall, the risk environment remains supportive of high-beta currencies but be aware the overextended run we’ve seen in pairs the likes of AUD/JPY, NZD/CHF to name a few.
Outsized jobs report in Canada: The Canadian jobs report for August was another blockbuster one of 81.1K vs 20.0K expected, with the unemployment rate consistent at 5.7%, even if the big downer was the hourly wage rate, much lower than expected at 3.8% versus 4.5% economists called for. The split of full-time employment versus part-time was fairly poor, with full-time jobs at 23.8 K versus 17.5 K estimate, while part-time employment stood at 57.2 K versus 7.0 K estimate. The participation rate grew to 65.8% versus 65.6% estimate. The data, nonetheless, reaffirms the prospects of a Bank of Canada that would rather sit on the sidelines without an immediate urge to ease.
China announces RRR cut as trad weakness: China’s trade balance, published on Sunday, continues to struggle as exports growth came weaker than expected at -1% yr/yr vs +3.3% in July. There were no signs of ‘front loading’ exports or imports ahead of the tariff hikes from Sept 1st. Besides, in order to keep underpinning economic activity via greater money supply to encourage lending to the corporate sector, China announced a further easing in monetary policy by cutting the Reserve Requirement Ratio (RRR) by ½ percent to 13%. It will be applicable to all bank from Sept 16th. There will also be a further 1% reduction for additional commercial banks in mid-Oct and mid-Nov.
RBA Lowe reflects on what's left in the toolkit: RBA Governor Lowe was interviewed by the Sydney Morning Herald, somehow admitting that the Central Bank is slowly headed towards an interest rate setting near zero, which makes the prospects of QE a possibility down the road. The SMH, not quoting Lowe directly, notes: “Lowe fears that our time is up. He’s using his power over interest rates to pull Australia back from the brink. But official rates are nearing zero percent. Lowe is preparing the way for the eventuality that they hit zero and need to go further, into the weird world of “unconventional” measures.”
Brexit playout a tough one: On the Brexit front, UK PM Boris Johnson won the English court ruling on parliament prorogation, while the Brexit delay bill also passed without any setback the House of Lords, now set for royal assent. Once the new law is fully legitimized by the UK lawmaking system, Labour has vowed to be ready for an election. The Pound remains well supported as the risk of a hard-Brexit by Oct 31st has been largely reduced even if a few EU officials are making the wrong noises for the Pound by stating their reluctant to concede another Brexit extension, among them France's foreign minister, Jean-Yves Le Drain or Belgian politician Guy Verhoftstadt. Remember, the playbook to trade the GBP keeps changing every day, so if you dare to trade the market, you must be the brave type keeping up with all the relevant Brexit-related news.
Recent Economic Indicators & Events Ahead
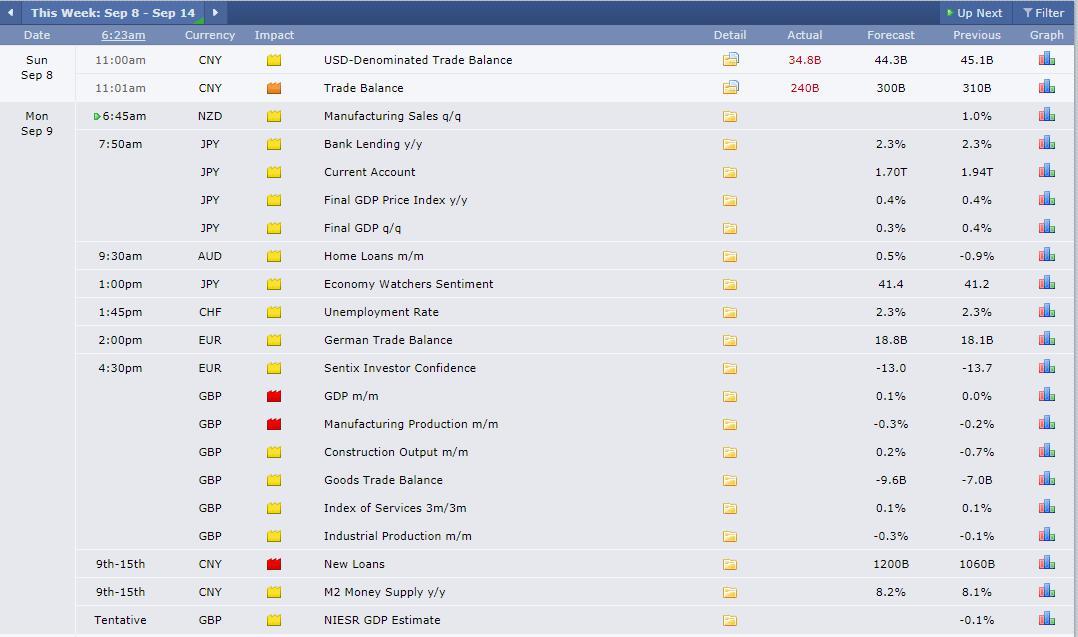
Source: Forexfactory
A Dive Into The Charts
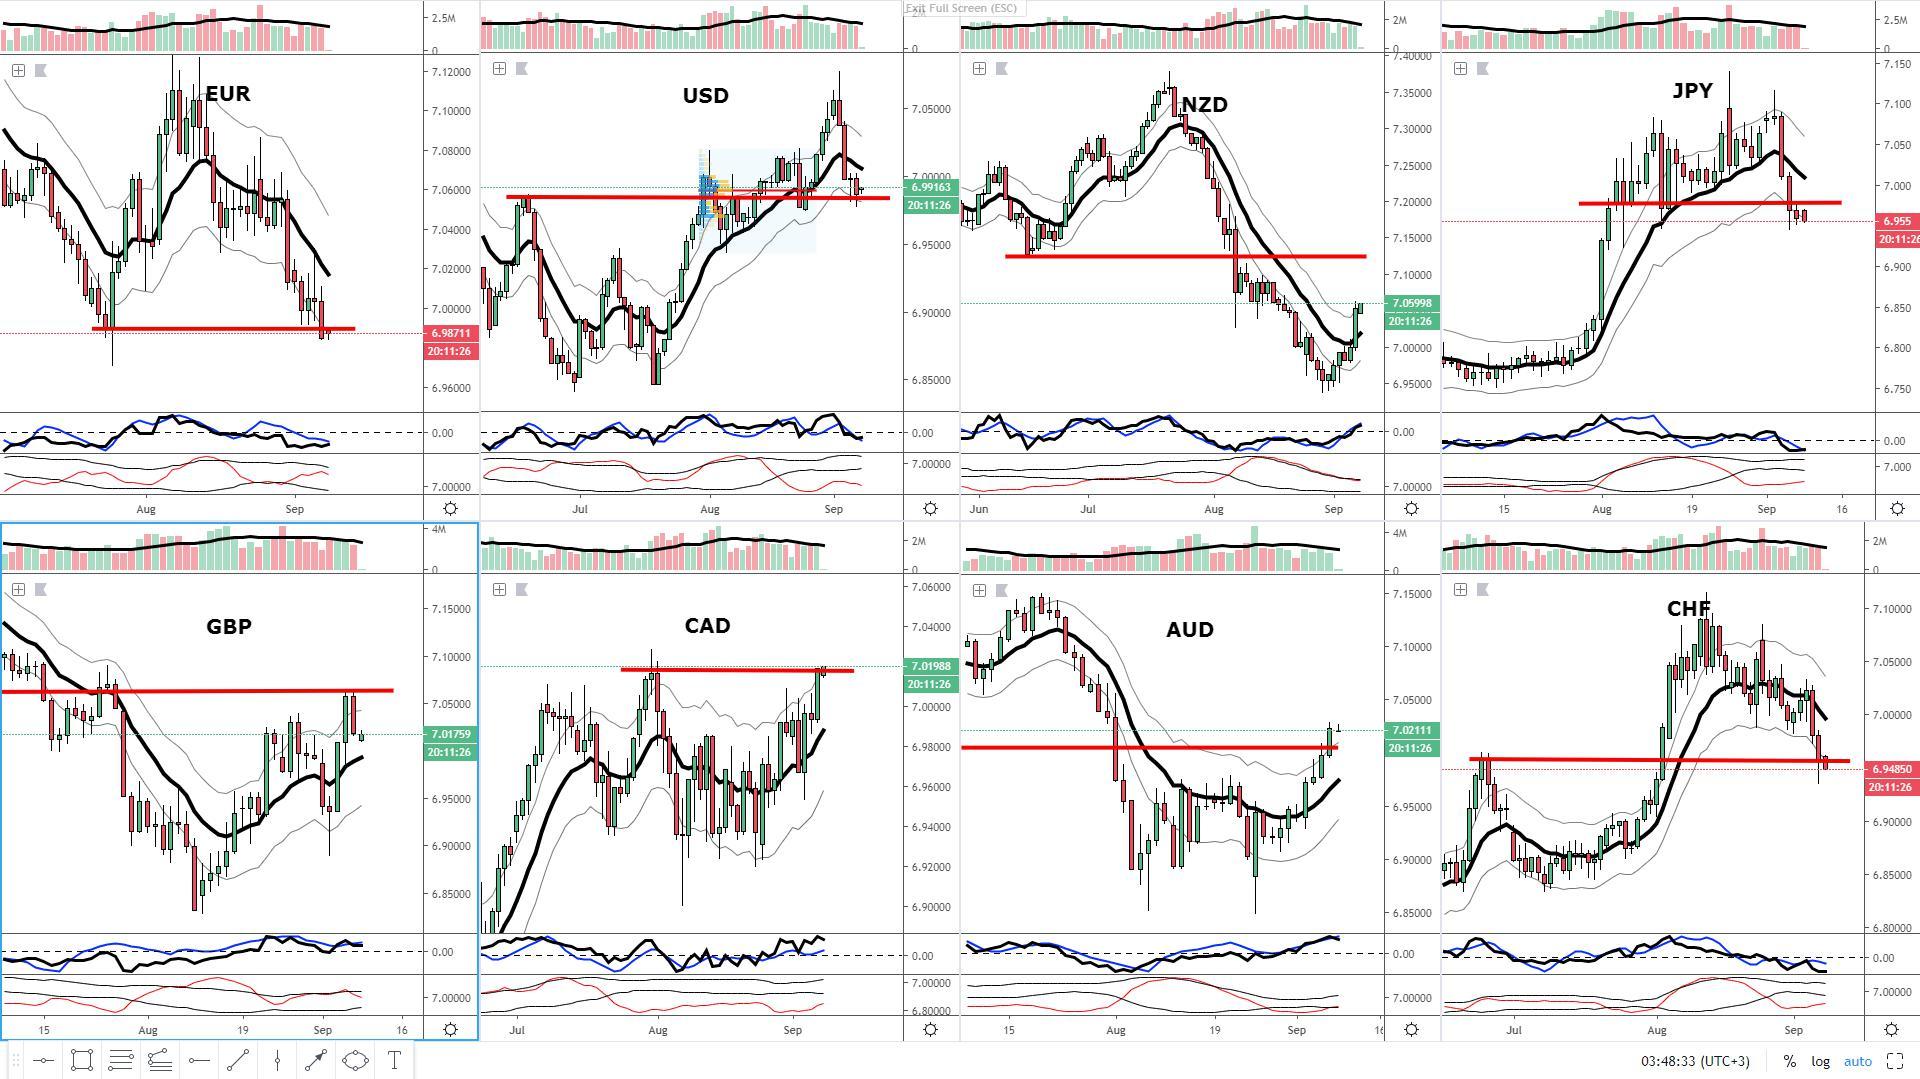
The EUR index continues to be in a slump, with a familiar pattern of selling-off aggressively ahead of the ECB policy meeting this week once again seen. What this means is that the market is setting itself up for a potential disappointment should the ECB not overdeliver the dovish policy expectations currently being priced. This is precisely what happened back in July. Technically, the close at the lows of NY below a highlighted support level is a very poor omen for the currency heading into the ECB. We could be facing another few days of EUR selling easily.
The GBP index exhibits a rather bright outlook to start the week, with the structure of higher highs and higher lows confirmed after the close above the previous high on Aug 26th. The recent rise has also allowed the first rising bottom in the index since early March this year, which strengthens the notion of bulls being in control of price action. Note, the Serling is facing a key technical obstacle at the recent trend highs that aligns with a previous macro support broken.
The USD index is in bearish territory but so far well underpinned by a key technical confluent juncture in the form of a weekly support level coupled with a retest of the 50% retrac of the prior balance area. The aggregate tick volume on the way down shows a devoid of participation, which combined with the ongoing bullish structure in the index, makes the USD a clear contender to see technically-driven demand returning at what’s arguably one of the best positions to engage in a trade, that is, at the retest of the 50% balance area in a trend. I wouldn’t be surprised if we see the index retesting the baseline (13d ema) next.
The CAD index has made it all the way to retest an important resistance level, which is where the price has paused as an equilibrium between bids and offers is found. The close at the high of the day is a red flag not to get in the way of the CAD bull train, which continues to be backed up by hot fundamentals (BOC not ready to cut rates short term + Canadian jobs data last Friday argues against easing as well). The index is far from trading at an optimal or discounted price level but it doesn’t mean it won’t continue to seduce momentum strategies from playing longs.
The AUD index has broken the weekly resistance level I had pointed out the prior week, paving the way for further gains in the week ahead. The overextension of the price outside it 1-time ATR from the baseline, alongside the tapering of aggregate tick volume, however, does suggest that the context is set up for a potential retracement towards either retesting the weekly resistance now turned support or experience a sharper pullback to its baseline. The bullish prospects are undeniable but the pricing to be paid for the AUD is just too expensive unless you are going to be in and out of the market in the lower time frames.
The NZD index is finally starting to catch a very solid bid, emboldened by calls that the RBNZ will refrain from being as aggressive in its easing policies as previously thought. The risk appetite is undoubtedly also leading to some macro shorts to unwind their positions in what’s been arguably one of the best trends to trade, now officially reversed as the baseline got taken out. There is further room for the NZD to bank the rather void space in the chart until a weekly resistance level about 1% higher than where it closed last Friday.
The JPY index continues to be punished as the market dumps the currency in light of the rampant risk appetite present since mid-last week. The close below a key daily support line is another technical testament that the outlook for the JPY looks rather dire. Technical levels tend to get overridden by the relevance of sentiment/fundamentals, which is precisely why we saw the limited resistance by buyers to step into the bearish momentum. No reason to think the JPY sellers will give up at this stage as they have in favor technicals and sentiment.
The CHF index, in a very similar fashion as the JPY index, keeps plummeting as the risk appetite conditions settle in. The close last Friday came right at a key weekly support line, but the rate of acceleration in the index’s decline, alongside the increase in aggregate tick volume, does not bode well for the interest of the Swissy. Analogous to the JPY, the currency CHF finds itself without contextual support in sentiment nor favorable technicals in place.
Important Footnotes
- Risk model: The fact that financial markets have become so intertwined and dynamic makes it essential to stay constantly in tune with market conditions and adapt to new environments. This prop model will assist you to gauge the context that you are trading so that you can significantly reduce the downside risks. To understand the principles applied in the assessment of this model, refer to the tutorial How to Unpack Risk Sentiment Profiles
- Cycles: Markets evolve in cycles followed by a period of distribution and/or accumulation. To understand the principles applied in the assessment of cycles, refer to the tutorial How To Read Market Structures In Forex
- POC: It refers to the point of control. It represents the areas of most interest by trading volume and should act as walls of bids/offers that may result in price reversals. The volume profile analysis tracks trading activity over a specified time period at specified price levels. The study reveals the constant evolution of the market auction process. If you wish to find out more about the importance of the POC, refer to the tutorial How to Read Volume Profile Structures
- Tick Volume: Price updates activity provides great insights into the actual buy or sell-side commitment to be engaged into a specific directional movement. Studies validate that price updates (tick volume) are highly correlated to actual traded volume, with the correlation being very high, when looking at hourly data. If you wish to find out more about the importance tick volume, refer to the tutorial on Why Is Tick Volume Important To Monitor?
- Horizontal Support/Resistance: Unlike levels of dynamic support or resistance or more subjective measurements such as fibonacci retracements, pivot points, trendlines, or other forms of reactive areas, the horizontal lines of support and resistance are universal concepts used by the majority of market participants. It, therefore, makes the areas the most widely followed and relevant to monitor. The Ultimate Guide To Identify Areas Of High Interest In Any Market
- Trendlines: Besides the horizontal lines, trendlines are helpful as a visual representation of the trend. The trendlines are drawn respecting a series of rules that determine the validation of a new cycle being created. Therefore, these trendline drawn in the chart hinge to a certain interpretation of market structures.
- Correlations: Each forex pair has a series of highly correlated assets to assess valuations. This type of study is called inter-market analysis and it involves scoping out anomalies in the ever-evolving global interconnectivity between equities, bonds, currencies, and commodities. If you would like to understand more about this concept, refer to the tutorial How Divergence In Correlated Assets Can Help You Add An Edge.
- Fundamentals: It’s important to highlight that the daily market outlook provided in this report is subject to the impact of the fundamental news. Any unexpected news may cause the price to behave erratically in the short term.
- Projection Targets: The usefulness of the 100% projection resides in the symmetry and harmonic relationships of market cycles. By drawing a 100% projection, you can anticipate the area in the chart where some type of pause and potential reversals in price is likely to occur, due to 1. The side in control of the cycle takes profits 2. Counter-trend positions are added by contrarian players 3. These are price points where limit orders are set by market-makers. You can find out more by reading the tutorial on The Magical 100% Fibonacci Projection