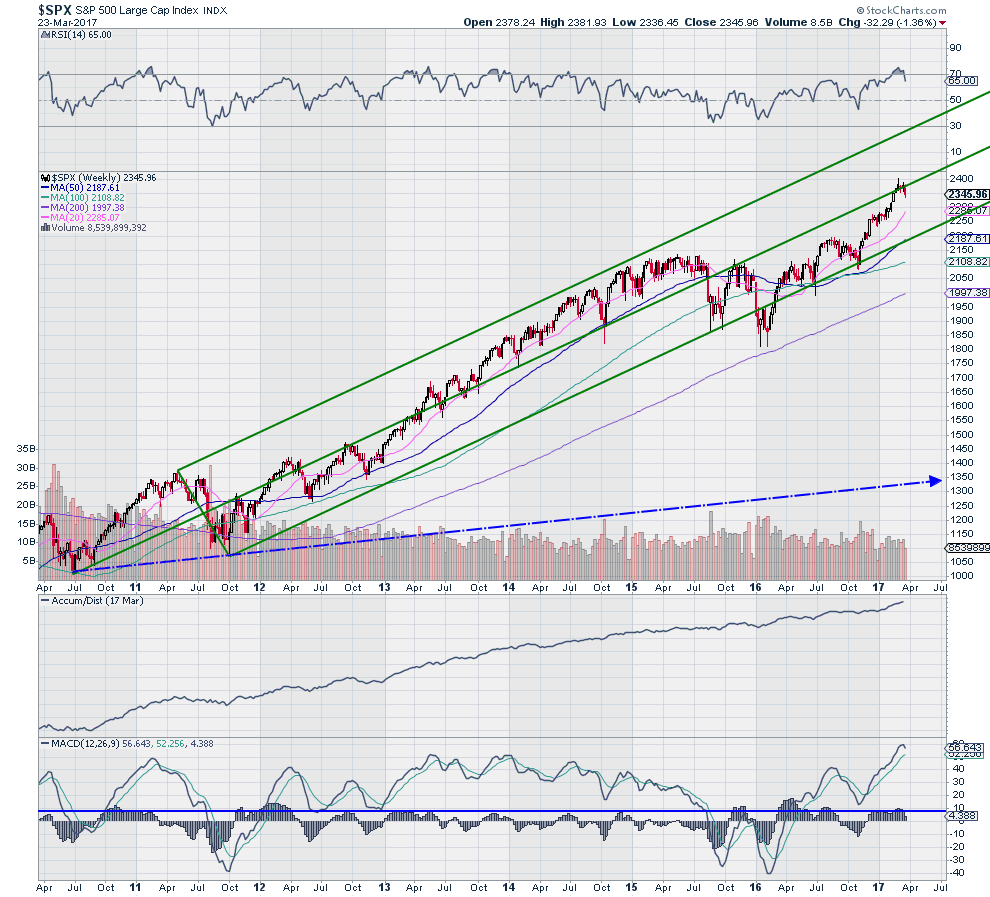
The pitchfork that draws my attention is the one that remains in place in the chart of the S&P 500. Seen in the weekly chart of the S&P 500 below, the Andrew’s Pitchfork has held up for over 6 years.
Since demarking the Upper and Lower Median Lines, the S&P has rode higher within the two ‘tines’ of the pitchfork. Early 2016 was a test as it fell out of the pitchfork. But it did not even come close to the Hagopian Trigger Line (blue), where a long term short would trigger. Instead it did not even retrace to the 200 week SMA before jumping back into the pitchfork.
All the while the S&P 500 has been accumulated. Momentum has gotten hot and a pullback could certainly occur. Or as the S&P is at the Median Line, it could correct through time, moving sideways until it hits that Lower Median Line again. What is clear is that the trend remains up.
The information in this blog post represents my own opinions and does not contain a recommendation for any particular security or investment. I or my affiliates may hold positions or other interests in securities mentioned in the Blog, please see my Disclaimer page for my full disclaimer.

