This one powerful tip will make you a better investor.
It’s a simple idea, and yet, despite all the evidence I’ll show you, I’m willing to bet the majority of readers won’t take advantage of this easy moneymaking strategy.
They’ll continue to think they are an outlier... that they, unlike the masses, can beat the odds.
Let’s start with a question that has a startling answer. What’s the average holding period for a share of Apple (O:AAPL)?
A decade? Far from it.
Five years? Much lower.
One year? Even lower.
Proving that investors are quickly losing their patience, the average share of Apple changes hands once every five months.
That’s a crazy figure. It proves investors are trading on headlines, emotions and gut instinct... not the sort of fundamentals that we know truly lead stocks higher.
After all, just like all publicly traded companies, Apple announces its latest sales and profits just once every three months. If shareholders (if we can even call them that) are holding for a mere five months, most hold for just one earnings announcement.
That means they aren’t buying a true stake in the company... they’re buying a few months’ worth of headlines.
It’s a dangerous - and stupid - trend.
Of course, this goes far beyond a single stock...
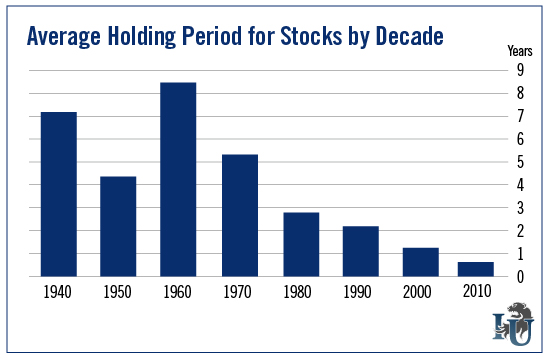
Our research shows that throughout the modern investing era, the average holding period for a stock has been four years. But it peaked in the 1960s and has been falling ever since.

These days, it’s reached an all-time low... 17 weeks. According to Credit Suisse, the annual turnover rate for American stocks is 307%. (If you were to hold a stock for a full year, the turnover rate would be 100%.)
But wait... there’s more.
The news gets worse for the market’s most popular ETFs. When we look at the buying and selling rate of the 20 largest ETFs, the annual turnover rate soars to over 1,200%.
Each share is held an average of just 29 days.
Meanwhile, the average holding period for the popular S&P 500 SPDR is a mere five days.
Yes, the advent of high-speed trading plays a role in the figures. But we must not discount the fact that the current trend has some mirrors throughout history... like in 1901 when annual turnover spiked to over 300% as speculators poured in and out of the market.
Computers certainly didn’t play a role in that trading frenzy. There’s something larger going on today. We attribute it to the “short-termism” that’s present throughout our modern culture.
We spend less time in our houses... our jobs... and, gulp, our marriages.
No matter the cause, with so much moving in and out of stocks, we’re not surprised the average investor can’t keep pace with the markets... let alone the leading sectors and industries.
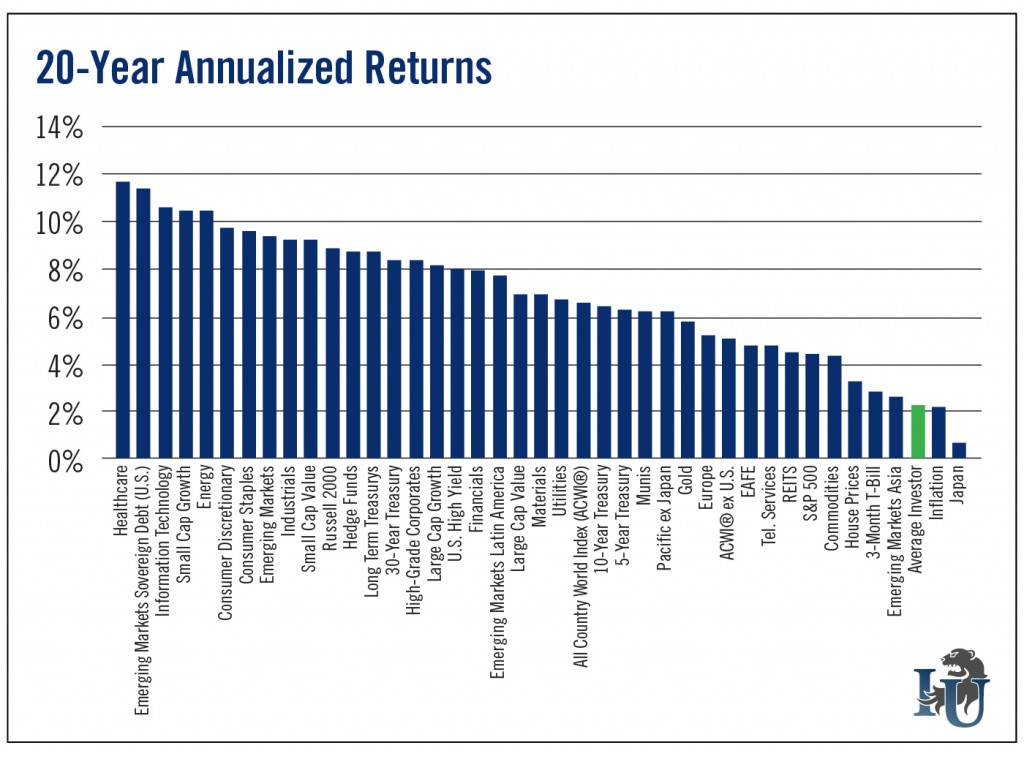
It leads us to our favorite chart - a chart we show our Members regularly.

The chart shows the annualized returns of nearly every asset class over the last 20 years. High performers are on the left... while the paltry returns of the average investor are on the right, barely ahead of inflation.
Again, with so much in-and-out trading, it makes perfect sense. Virtually every trader has likely owned the market leaders over the last two decades. But they almost certainly didn’t hold them long enough to reap their outsized rewards.
Most likely, as history begs to remind us, they bought too high and sold too low.
It takes us to what we believe is the simplest moneymaking tip... that you won’t use.
Hold your positions longer.
It’s hard. I know. It’s quite easy to be an emotional investor who reacts to the hyperbolic headlines and nonstop news feeds.
But there’s a simple and super-effective way to force emotion out of your trading. It’s been the backbone of the Club’s success for more than two decades. Simply outline your exit strategy before you buy - and stick to it.
At the Club, we most often use trailing stops. They work best. But there are other options. You can plan to sell when shares hit a preset price. You can sell when earnings growth slows to a certain percentage. You can sell when the CEO leaves.
Just don’t sell when your gut tells you to. Your gut is wrong.
There’s an unspoken secret on Wall Street - some call it “time arbitrage.” The longer you can hold a position, the higher your odds of success. It’s 100% true.
Take advantage of it.
Next Sunday, we’ll reveal the one and only reason The Oxford Club tells Members to make short-term investments.
