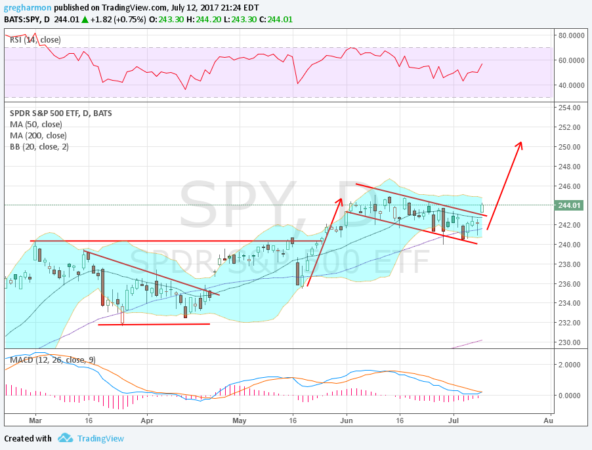
Since ending a strong run higher at the end of February it has been a tough 4 and a half months for the S&P 500. Two months of slow drawn out movement lower to start. It did not amount to much. Not even a 4% pullback. And then another month to get back to even. It looked like it would break higher then but could only manage a less than 2% gain before topping in June and embarking on another 6 week pullback. The full range covered 12 points in the SPY (NYSE:SPY) ETF, or about 5% for the period, to end up less than 2% above the February 28 close on Wednesday. That works out to less that 5% annual return. Not horrible, but not great either. But the future looks bright.
The chart below explains why. The pullback that began at the beginning of June moved lower in a falling channel. Last week it touched the 50 day SMA and bounced. The 50 day SMA was the catalyst for a move higher on the 2 day pullback in May as well. And Wednesday took the price up above that falling channel. That establishes a price target of about 250.50 on a Measured Move higher.

That small move in price was significant because the momentum has already started to shift to the upside. The RSI held over 40, in the bullish zone, throughout the pullback and is now pushing back higher. The MACD reset much lower during the pullback and had started to level and turn up. Now it is set to cross positive Thursday, a buy signal. A final confirmation will happen when the SPY sets a new all-time closing high. The Dow did it Wednesday, will the S&P 500 be Thursday?
The information in this blog post represents my own opinions and does not contain a recommendation for any particular security or investment. I or my affiliates may hold positions or other interests in securities mentioned in the Blog, please see my Disclaimer page for my full disclaimer.
