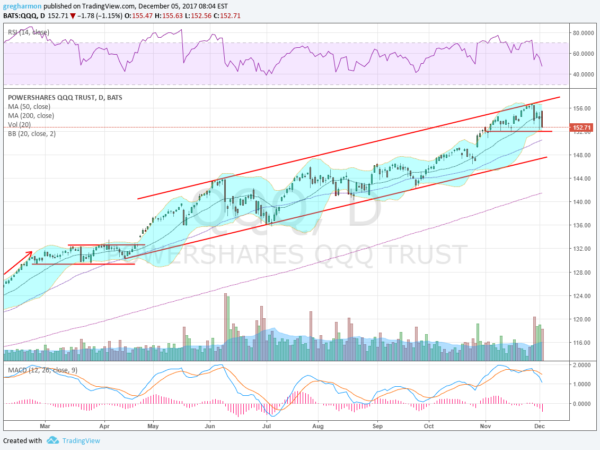
The Nasdaq 100 has been humming along the road higher with the cruise control on until last week. That is when it hit a pothole on the highway higher and pulled back. The big question now is whether the pothole was shallow and did little damage or is there deeper trouble lurking within it. I don’t have the answer to that, no one does, but there are some things to watch in the chart that can help you navigate the road ahead.
The chart below shows the way. Ever since rising out of consolidation in April the Nasdaq 100 ETF (PowerShares QQQ Trust Series 1 (NASDAQ:QQQ)) has been moving higher in a channel. Each retracement has found support around the 50 day SMA as it moves higher. But with the touch at the top of the channel last week it is moving toward the lower bound. The first level to watch is the recent short term support at 152. This is also at the lower Bollinger Band®, a place where price often finds support. A reversal here is a show of strength.

The next spot would be the 50 day SMA, currently at 150.50. As noted above, pullbacks have stopped shortly after passing the 50 day SMA each time in this channel. Third is the bottom of the channel at about 148. This is also near the bottom of the gap at 147.71. There is technically no damage to the uptrend unless it moves below this level.
Momentum is waning in the bullish zone and nearing bearish territory. The RSI is at the October low. Keep an eye on this as a lower low in the RSI without a lower low in price would trigger a Positive RSI Reversal with a $10 target move higher. Volume has been higher than normal on this retracement. Look to see if it starts to fall off as well as that can be a sign of exhaustion.
The information in this blog post represents my own opinions and does not contain a recommendation for any particular security or investment. I or my affiliates may hold positions or other interests in securities mentioned in the Blog, please see my Disclaimer page for my full disclaimer.
