📈 Will you get serious about investing in 2025? Take the first step with 50% off InvestingProClaim Offer

The Most Shorted Stocks Surge In The Land Of Make Believe On January 25

Published 01/26/2021, 12:21 AM
Updated 11/16/2024, 07:53 AM
US500
-
SPY
-
VIX
-
TDOC
-
PYPL
-
SQ
-
VXX
-

Another fun day in the land of make believe, with the S&P 500 rising by 35 bps. Most of the gains came in the final few minutes of trading, essentially the opposite of what we saw on Friday. Meanwhile, the most shorted index soared by over 2.2%. The index has taken on a life of its own; it is really rather stunning.

S&P 500 (SPY)

The S&P 500 failed to take out Friday’s highs. At this point, it could mean something. Depending on what happens tomorrow, there are potentially three lower highs on the intraday chart. Ideally, the bulls need to see today’s high taken out tomorrow.
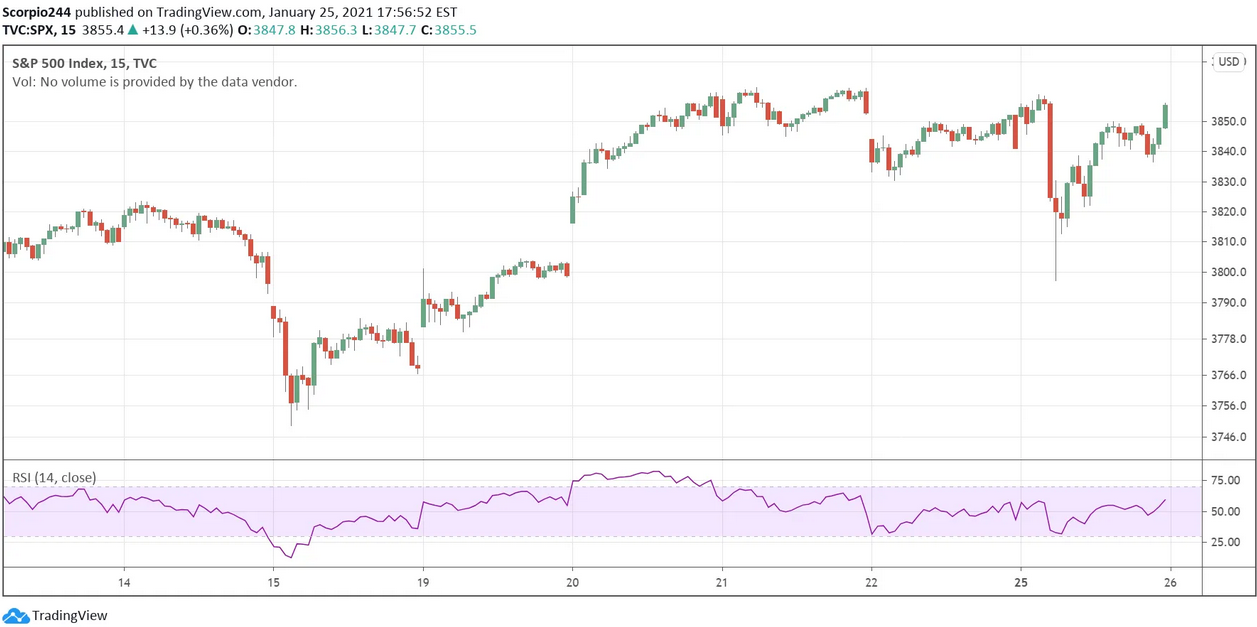
S&P 500 Index Chart

We can also see that the move higher is starting to tighten up, meaning the range is growing small, creating a rising wedge pattern. Additionally, the RSI has not confirmed the new highs with a new high of its own, and the Advance/Decline has now, potentially, stalled. A break of that lower trend could result in a steep pullback back to 3,200.
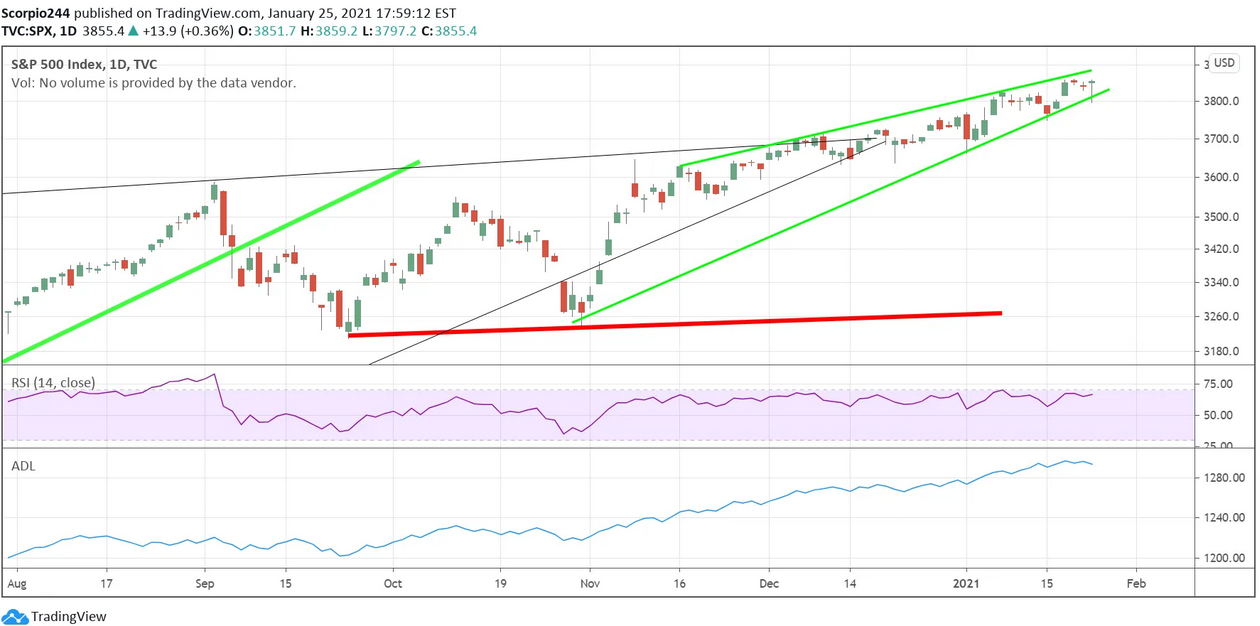
S&P 500 Index Daily Chart

VIX (VXX)

The VIX had a pretty big day rising by 5%, despite the S&P 500 climbing. If you think that is strange, well, it is. That isn’t supposed to be what happens, but it does every once in a while. String a couple of days like that together, along with the S&P 500 rising at the same time, and you probably have a situation where the market is ready for a pullback; at least that has been the “tell” in recent months.
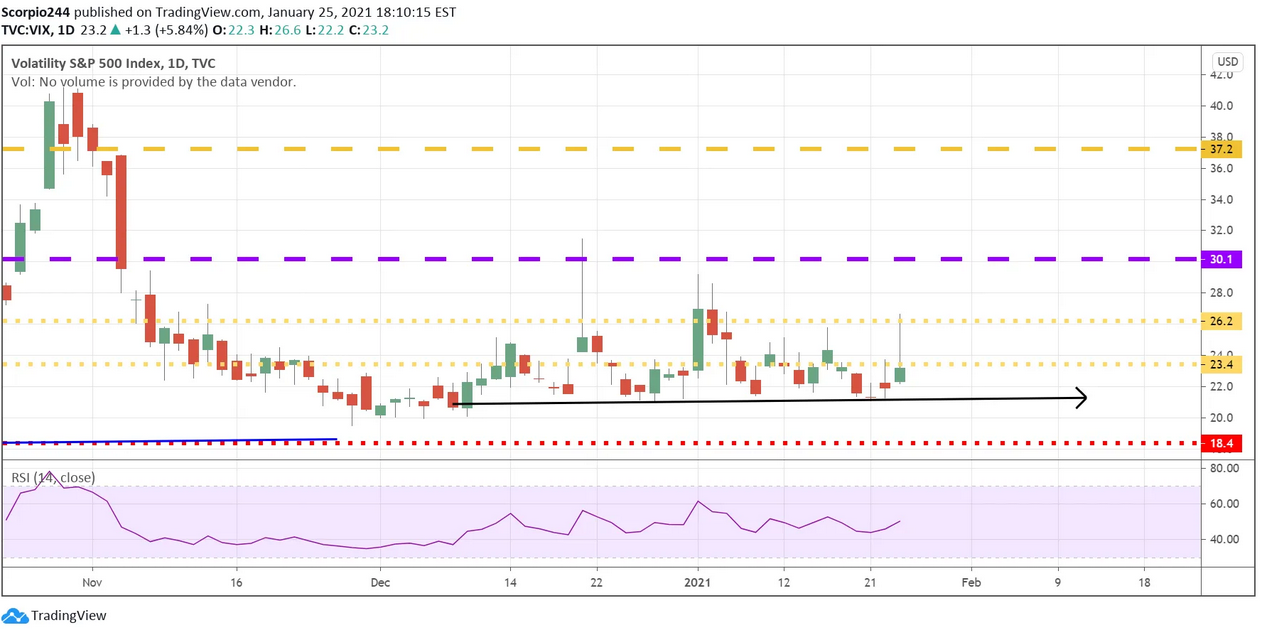
VIX Index Daily Chart

Square

Square (NYSE:SQ) did not have a good day, with the shares falling almost 3%, and is down about 12.5% from its peak. For now, it is still holding on to support around $216and has tested this level a couple of times. It likely breaks that support level, as the RSI shows a lot of momentum being lost and that lower prices are likely coming.
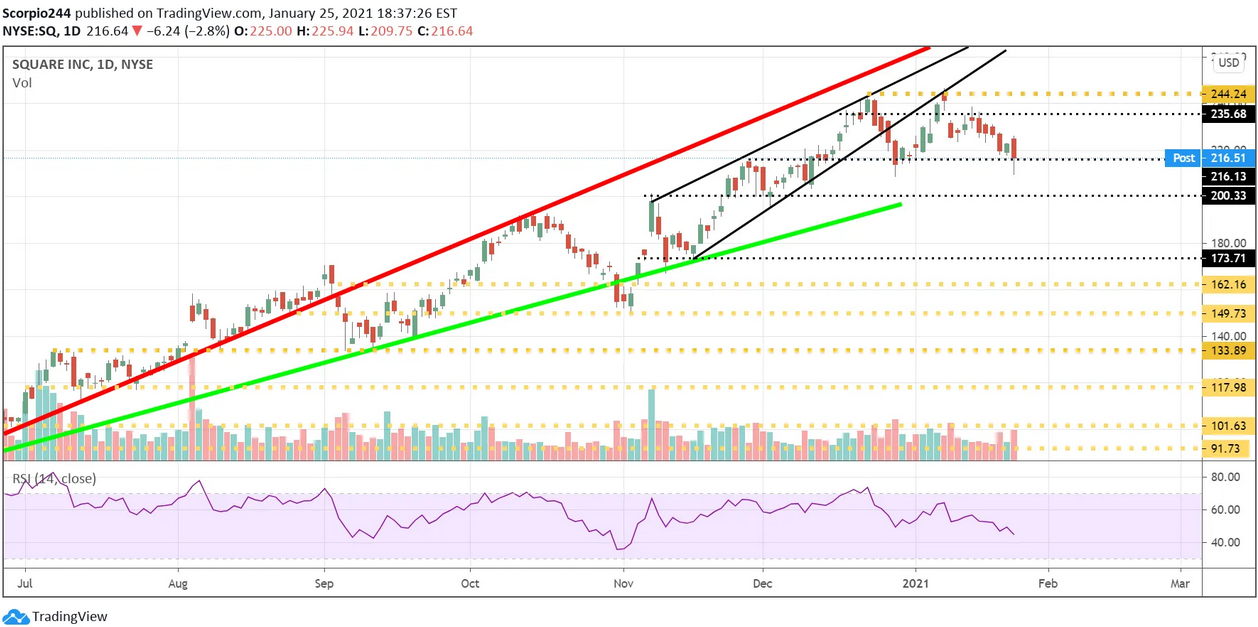
Square Inc Daily Chart

PayPal

PayPal (NASDAQ:PYPL) also appears to have a bearish pattern forming in it. With a potential rising wedge, along with an RSI that appears to be suggesting a decline to around $215.
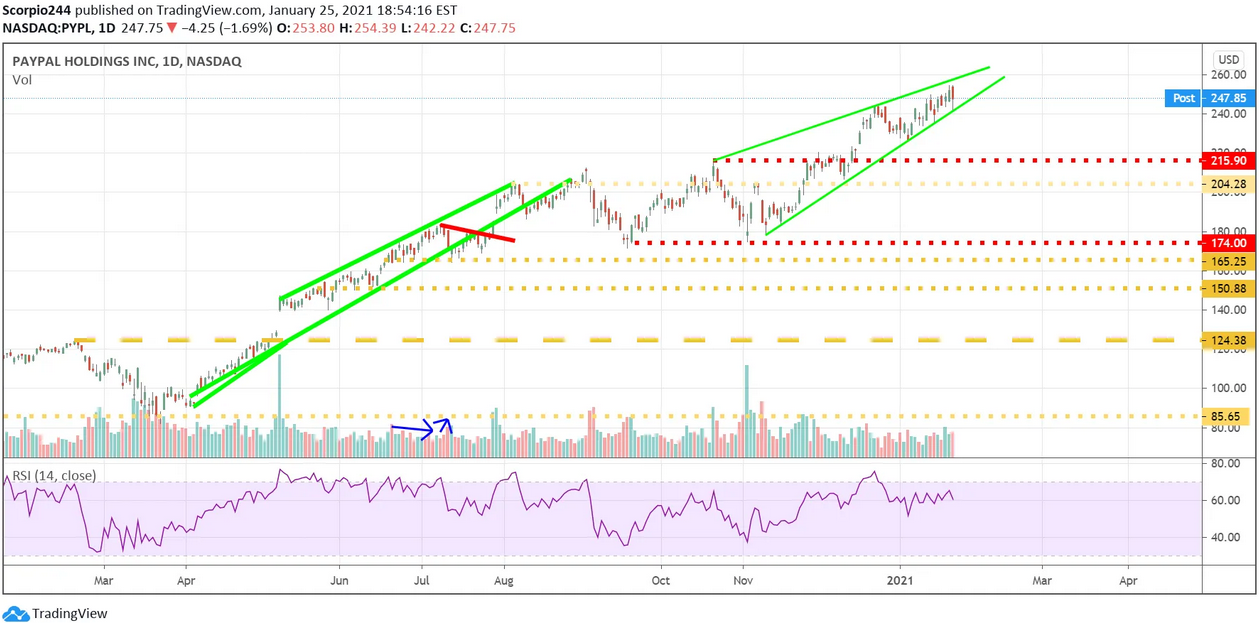
PayPal Inc Daily Chart

Teladoc

Teladoc (NYSE:TDOC) looks to be in the middle of a convexity/gamma squeeze. All the signs are there. Option volume exploding, implied volatility rising with the stock. It probably means a reversal lower in TDOC is around the corner.
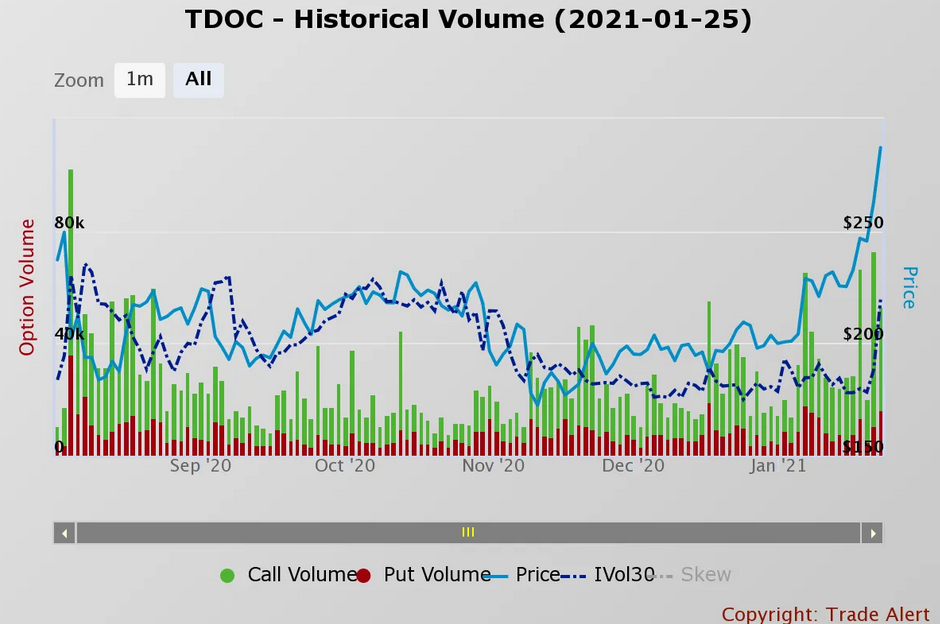
TDOC - Historical Volume

That’s it

Original Post

Latest comments

Loading next article…
Risk Disclosure: Trading in financial instruments and/or cryptocurrencies involves high risks including the risk of losing some, or all, of your investment amount, and may not be suitable for all investors. Prices of cryptocurrencies are extremely volatile and may be affected by external factors such as financial, regulatory or political events. Trading on margin increases the financial risks.
Before deciding to trade in financial instrument or cryptocurrencies you should be fully informed of the risks and costs associated with trading the financial markets, carefully consider your investment objectives, level of experience, and risk appetite, and seek professional advice where needed.
Fusion Media would like to remind you that the data contained in this website is not necessarily real-time nor accurate. The data and prices on the website are not necessarily provided by any market or exchange, but may be provided by market makers, and so prices may not be accurate and may differ from the actual price at any given market, meaning prices are indicative and not appropriate for trading purposes. Fusion Media and any provider of the data contained in this website will not accept liability for any loss or damage as a result of your trading, or your reliance on the information contained within this website.
It is prohibited to use, store, reproduce, display, modify, transmit or distribute the data contained in this website without the explicit prior written permission of Fusion Media and/or the data provider. All intellectual property rights are reserved by the providers and/or the exchange providing the data contained in this website.
Fusion Media may be compensated by the advertisers that appear on the website, based on your interaction with the advertisements or advertisers.
© 2007-2025 - Fusion Media Limited. All Rights Reserved.