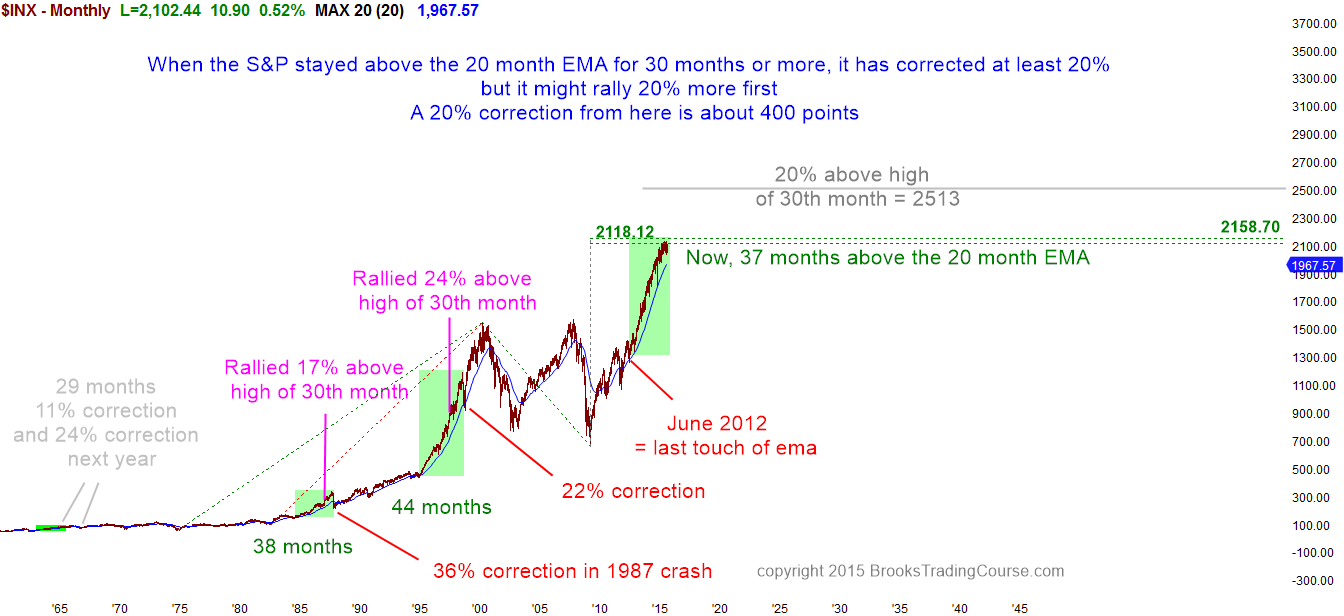
Monthly S&P 500 cash index chart

The monthly S&P 500 cash index chart has been above its 20 month exponential moving average for 39 months. It has only been above it for more time once in the past 50 years.
The monthly chart of the S&P 500 cash index has been above the 20 month exponential moving average for 39 months. There are only 2 comparable instance of this in the past 50 years. In 1998, the S&P cash index held above its moving average for 44 months. It then fell 22% in its test down to the average price.
That rally began with the Republicans taking over the House of Representatives in 1995, and it was the strongest rally on the monthly chart in my 28 years of day trading. The current rally is occurring much later in a bull trend, which means that there is more risk of exhaustion and less likelihood of the rally lasting longer than any prior rally above the moving average. This makes it less likely that it will hold above the average as long as it did in 1998. If it holds above it for 44 months, then the touch of the moving average would be in February, and the top would probably be at least a month or two before. If it touches the moving average in fewer months, then the top would be even earlier, like within the next few months.
The only other time when the stock market held above its moving average for 38 months was in October 1987. The Crash resulted in the monthly cash index testing below the moving average in the 39th month.
While I doubt the market will crash now, the odds are probably 80% that it will reach the moving average before February, and probably within the next few months. Since the moving average is about 200 points below the high, this means that there is about an 80% chance of at least a 10% correction within the next several months. The S&P cash index corrected 36% after the 1987 rally and 22% after the 1998 rally. I believe that means that the current rally will probably correct about 20% over the next year, which would put it below the October low.
Whenever the stock market does something unusual, the move is unsustainable and therefore climactic. Even though the S&P cash index has been sideways for 7 months, it is still doing something that is unsustainable (holding above its moving average for an exceptional length of time), and it is therefore in a buy climax. The guideline I use is that whenever there is a climax, I expect about or at least a 10 bar sideways or opposite move lasting 10 bars and having 2 legs. Since this is a buy climax on the monthly chart, I am looking for 10 months (about a year) correction having at least 2 legs sideways to down.
Why am I using a 20 month exponential moving average? There is nothing magical about it. I could use a 50 month moving average. If I did, maybe the stock market would have to be above it for 60 months to be comparably overbought. If I used a 10 month moving average, maybe 20 months without touching it would be extreme. It does not matter which average a trader uses to determine whether a market is overbought. Just count how many bars the market has held above or below the average, and compare the current situation to past times. If the current behavior is extremely unusual, then it is unsustainable and climactic, and the odds favor a reasonably strong unwinding of the extreme behavior.
Although a 20% reversal would be a bear trend on the daily chart, it would probably create a bull flag on the monthly chart. It is unlikely that any major reversal would go straight down without testing up first. Even if the reversal down is more than 20%, the odds are that the stock market would test back up after the selloff, and not crash.
Although there is an 80% chance of at least a 10% correction, the stock market has been in a tight trading range for 7 months. It would only do that if the bulls and bears were perfectly balanced. This means that there is a 50% chance of a bull breakout and a 50% chance of a bear breakout. This does not chance the 80% chance of at least a 10% correction this year. There is time for a bull breakout, and it could last a month or two. However, if it happens, the odds are still 80% that there will be a 10% or more correction, which means that the bull breakout has a high probability of failing soon after it occurs.
