We are close to wrapping up the second quarter of 2018 and the market leaders have made themselves known. While every year has its winners and losers, this year the out performance is being held by just a select few and they nearly all fall into two one of two sectors. Year-to-date just four sectors are positive. That leaves us with two leading sectors: Consumer Discretionary and Technology, both having produced double-digit returns so far this year. What has me concerned is the degree in which the share of the gains seen in the market has been so dependent on just two sectors. Paired with some excessive readings in sentiment and volatility (which I address in the last paragraph of this post), some short-term concern may be warranted. The U.S. large cap market is currently performing an amazing balancing act but could lead to a tumble if we aren’t careful.
With that, let’s take a look at the relative performance of each of the main S&P sectors….
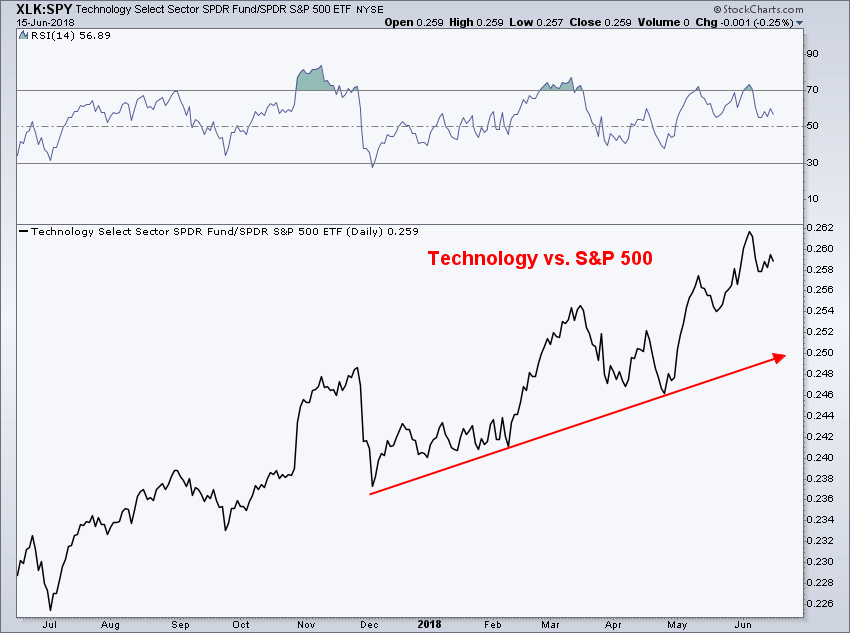
First up we have technology (Technology Select Sector SPDR (NYSE:XLK)). There have been many strong stocks that have come from the tech sector. In fact, 96 technology stocks (that have a market cap over $2 billion) are up over 30% YTD and 47% have produced a gain north of 50% (numbers based on Finviz data). The S&P 500 has been able to rely so heavily on tech because the sector holds a 26% weighting within the index with the second largest sector coming holding just 14.%. When such a large share of the SPX is based on a single sector, little else can matter if that one sector is acting incredibly strong.
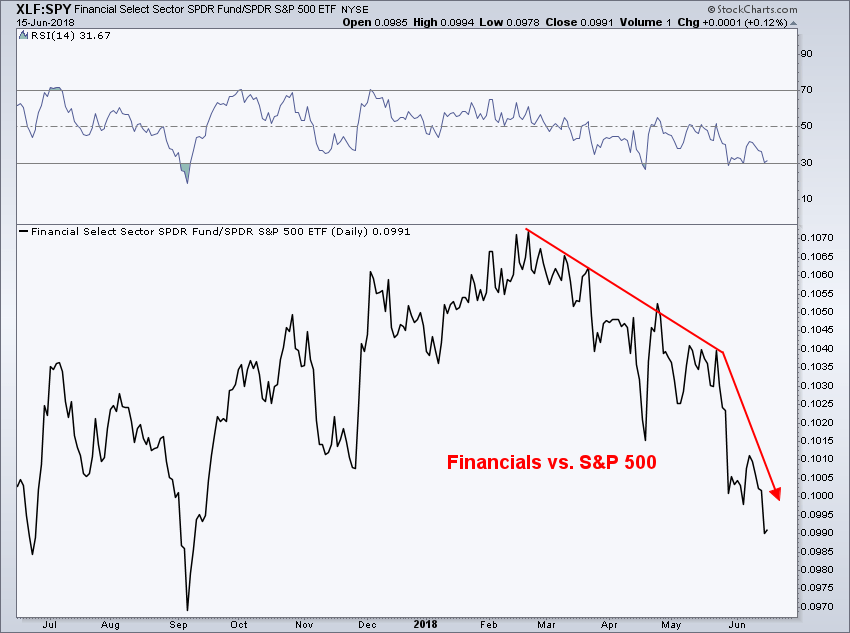
Next we have the second largest weighted sector of the S&P 500, Financials which is 14.2% of the S&P 500. Not a pretty relative performance trend. A major headwind for XLK (NYSE:XLK) has been the yield curve, which I’ve tweeted about numerous times this year – most recently an updated chart last week. With the yield curve continuing to flatten, it’s extremely difficult for financial sectors to strength relative to the index. So the strength in the U.S. large caps aren’t getting any favors for financials.
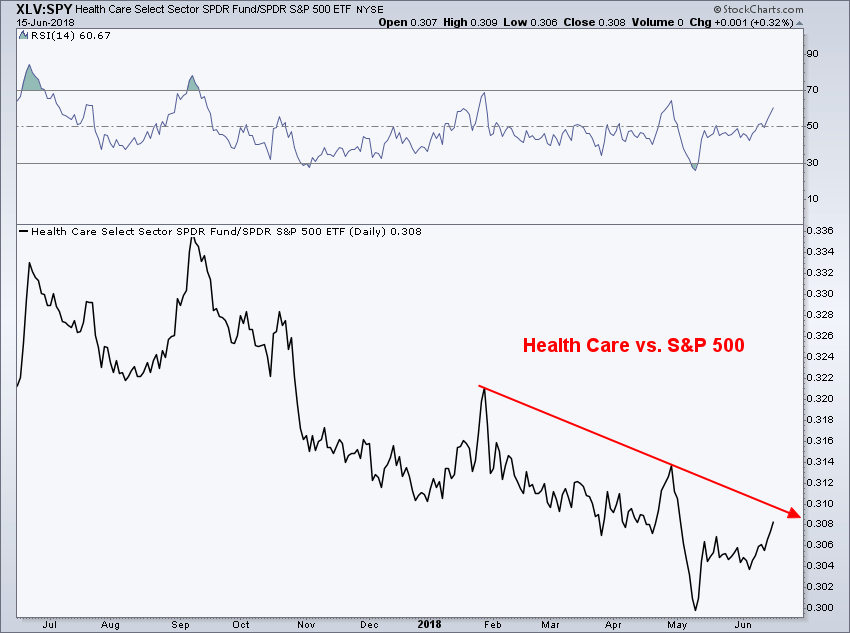
Next up, with a 13.9% weighting in the S&P 500 is Health Care. Another chart of lower highs as health care has struggled in relative performance. Recently we’ve seen a bit of improvement as Health Care Select Sector SPDR (NYSE:XLV) moves off its May low, but since January, it’s been a clear down trend for health care relative to the SPX.
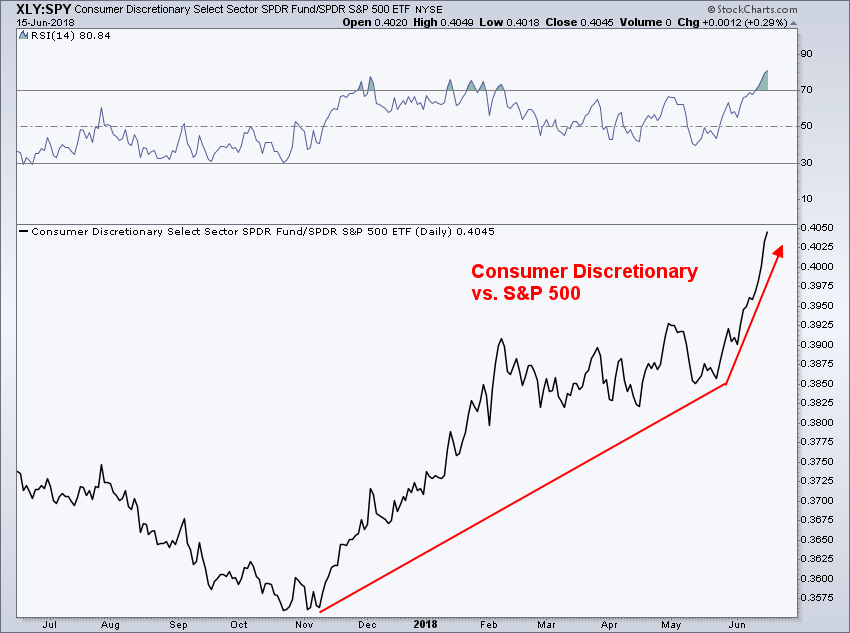
Consumer Discretionary (NYSE:XLY), our other market leader, holds the fourth largest weighting at 12.9%. Here we have a strong up trend since November, which has shifted into fifth gear since late-May as relative performance has gone near-vertical. Strength has been confirmed by the Relative Strength Index (RSI), which has maintained a bullish range, however its now above 80 which is a sign of strong momentum but short-term could be difficult to maintain.
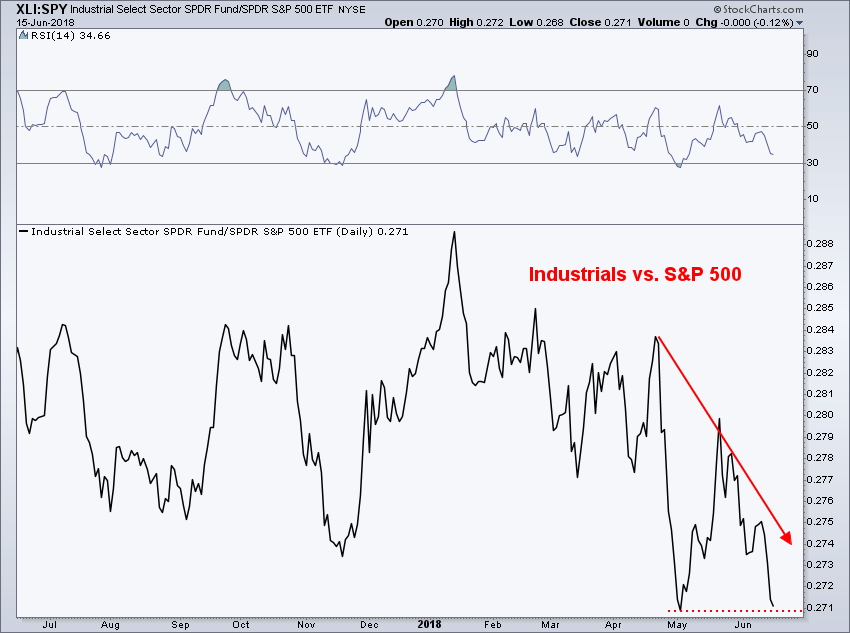
Industrials is our first sector to hold a sub-double digit weighting at 9.9% as of Friday. Once again, a series of lower highs in relative performance for this sector. The Ratio between XLI (NYSE:XLI) and SPY (NYSE:SPY) is now moving to potentially test the prior May low, it’ll be interesting to see if that low acts as support or if the current down trend cuts through to make a new low.
Next we have Consumer Staples with its 6.7% weighting. While its been a well-defined down trend in relative performance for staple stocks, there’s been one potentially bullish development recently in relative performance. As the ratio moves back above the May low, putting in a possible false breakdown, the RSI momentum indicator has created a bullish divergence with its higher low. This could lead to some continued strength in Consumer Staples Select Sector SPDR (NYSE:XLP), but the current down trend remains in tact until more improvement in consumer staples shows itself on the chart. The main point being that the strength in the S&P 500 hasn’t been helped by XLP this year.
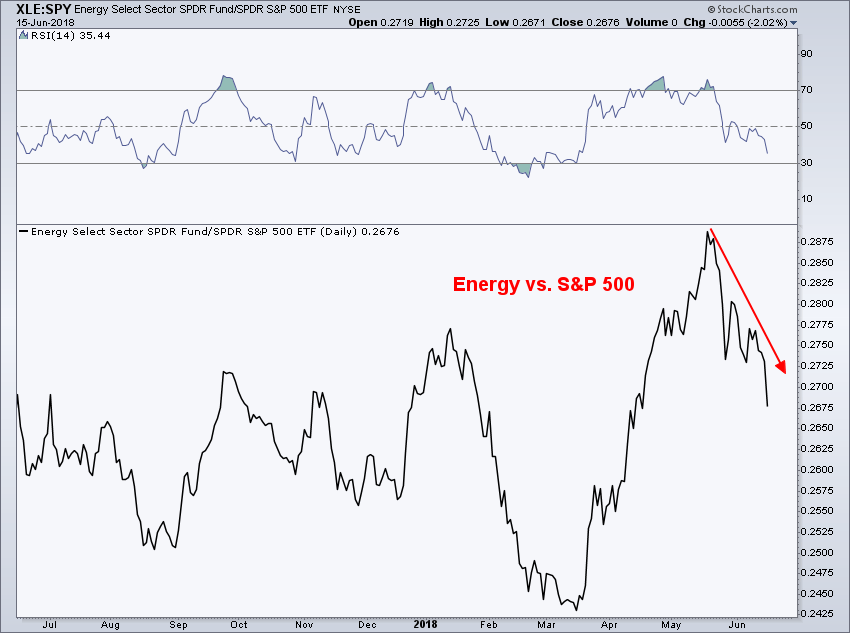
Following staples we have energy at 6.3% weighting in the S&P 500. Energy has had an interesting start to the year, taking several punches to start 2018 only to follow them up with some big strength of its own as oil prices began to strength and moving energy stocks higher. However, that brief pop has now been partially given back as relative performance for XLE (NYSE:XLE) has begun to once again drift lower with several lower highs and lower lows since May.
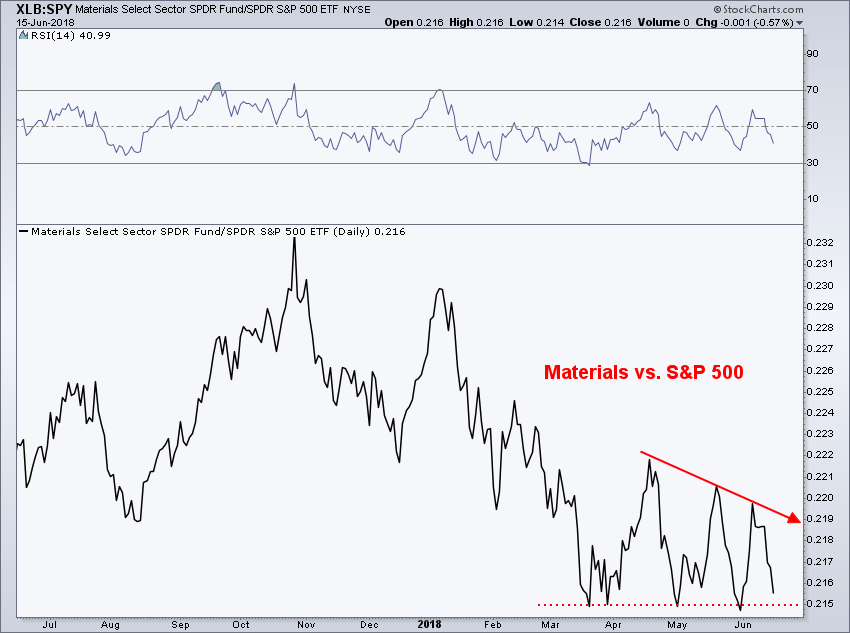
Materials, with its 2.8% weighting is our next sector. After a tough start to the year, Materials (NYSE:XLB) has been in somewhat of a range in relative performance for the last few months. While there haven’t been major lower lows, there have been several lower highs in the ratio between XLB and SPY, with the ratio most recently working its way back to the lower-end of that range as materials slide.
Also with a 2.8% weighting is Utilities (NYSE:XLU). With a tight relationship to credit markets, utilities have been all over the place in relative performance this year. Most recently a possible false breakdown has been shown on the ratio chart with a large bullish divergence taking place in the RSI momentum indicator. If the ratio can hold above the January/March low then we could see some improvement in relative performance for the utilities sector, which will likely need to see some weakness in Treasury yield to accomplish that. But for the last few months, utilities is another sector that’s been more of a drag on the S&P 500 than a supporting actor.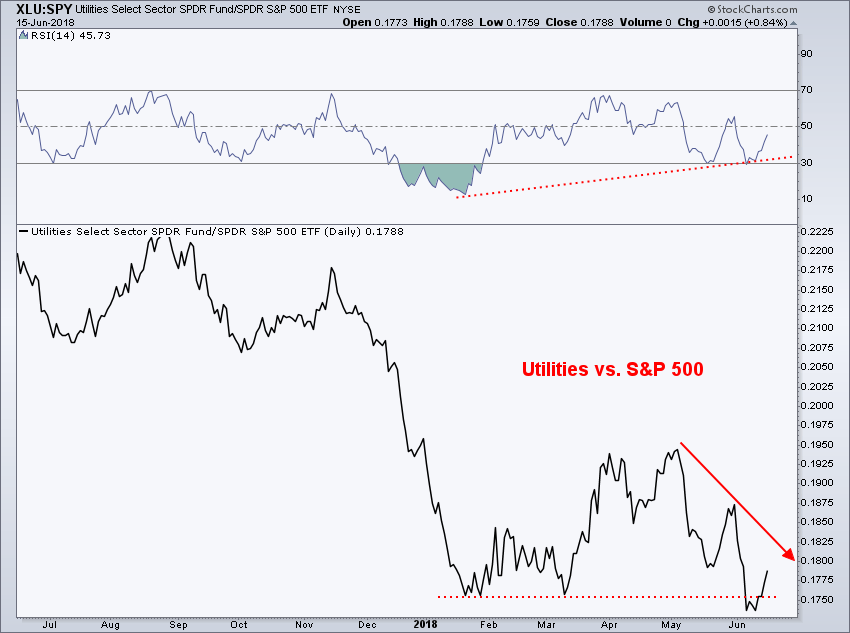
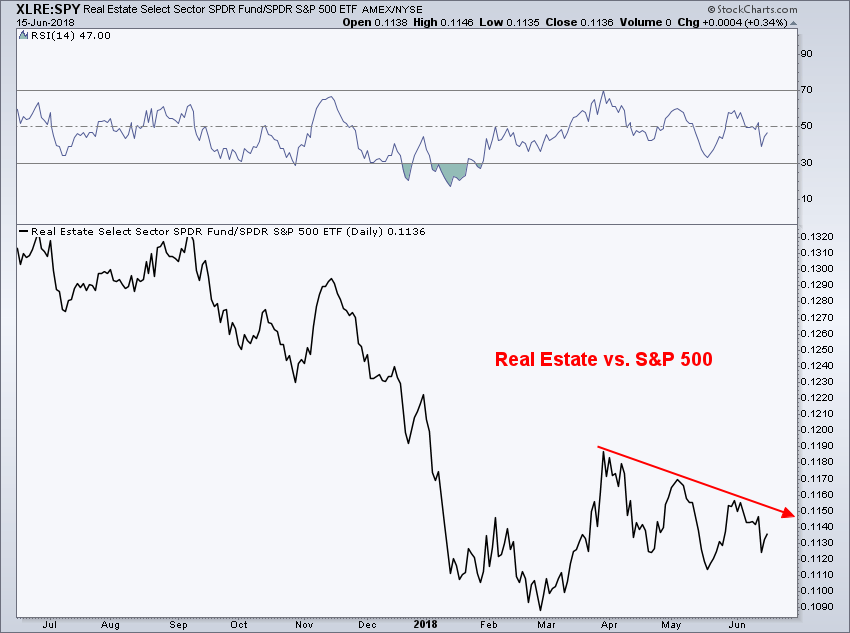
Finally, we have our smallest weighting sector at 2.7%: Real Estate (NYSE:XLRE) Since April, Real Estate has been trending lower in relative performance, but being the lowest weighted sector, there’s less of an impact by Real Estate and it’s market performance.
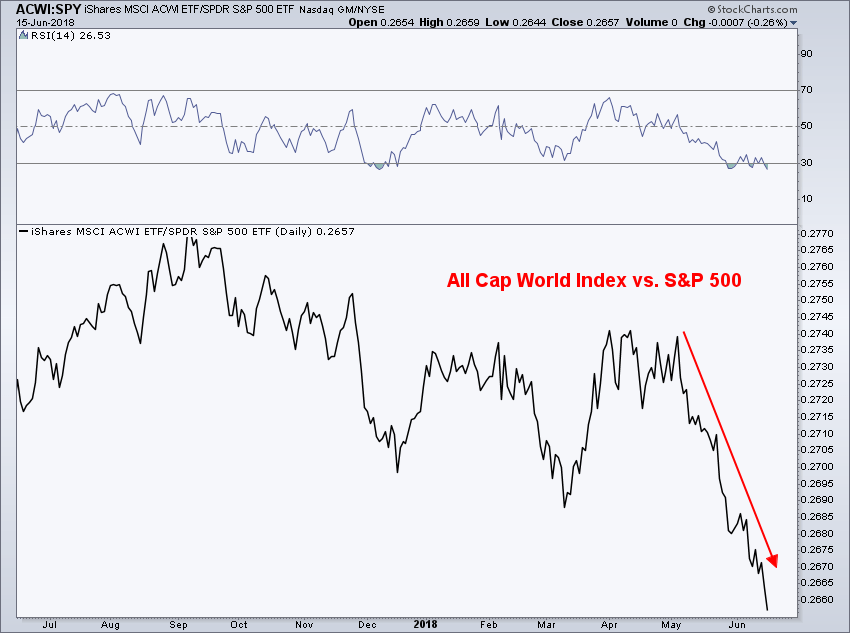
Well if it’s not the majority of the sectors that are driving market higher, maybe it’s international stocks? Well we know that’s not true, as the relative performance for the iShares MSCI ACWI (NASDAQ:ACWI) has been hitting fresh lows for most of the last month. It appears U.S. large caps are own their own internationally when looking for support in rising higher.
It’s normal for certain sectors to lead the market and to have periods of rotation between all the sectors as they take turns leading us to new highs in the major indices. However, I would be much more confidence if we weren’t relying on such a small sampling of the market to squeeze out the gains that have been produced thus far this year. Just a small miss-step in Consumer Discretionary or Technology could be troublesome for the overall market, especially with such a large weighting coming from tech. As a collective, we’ve put a lot of our eggs in the Silicon Valley basket.
With many sentiment gauges hitting high levels (NAAIM Exposure Index is 103% which is the third highest reading since 2007 and means the average net-long exposure to stocks by active managers is over 100% and the most bearish was actually still net-long!), a lack of interest in owning protection as shown by the extremely low put/call ratio and the Volatility Index sitting near multi-month lows. Meanwhile, Treasury volatility is off its low, volatility of the CBOE Volatility Index has been going up as has the SKEW Index which tells us that there is some protection buying in the tails as well as in the VIX but not in the S&P 500 futures. We seem to be at a high level of confidence right now which can be a short-term concern but a long-term positive. As I’ve said before, there are times where it’s good to have an umbrella handy before it rains rather than being caught without protection in a downpour. I think now is probably one of those times to pull out the proverbial umbrella, just in case the sky opens up and volatility returns.
Disclaimer: Do not construe anything written in this post or this blog in its entirety as a recommendation, research, or an offer to buy or sell any securities. Everything in this post is meant for educational and entertainment purposes only. I or my affiliates may hold positions in securities mentioned in the blog. Please see my Disclosure page for full disclaimer.
