Investing.com’s stocks of the week
I can’t; I can’t write another post saying that stocks fell on trade headlines. Does yesterday's decline even count? The S&P 500 was only down 66 basis points, that is like a typical trading day, right? Can’t we say stock fell because they have been overbought and they needed to fall?
This trade….stuff… is ridiculous, and the headlines and the news is just nauseating. The market has moved past it, it has. Had this happened in the Spring of 2019, or late last year, the market would have fallen by 2 to 3%, there is no doubt in my mind. Now, all it warrants is a 60 basis points drop on the S&P and a 30 basis point drop in the Russell? My, how times have changed. Again, it goes back to what we talked about a week or two ago, for the most part, I think the market mostly doesn’t care, or no longer belives all the doom and gloom that comes with the trade talk hype.
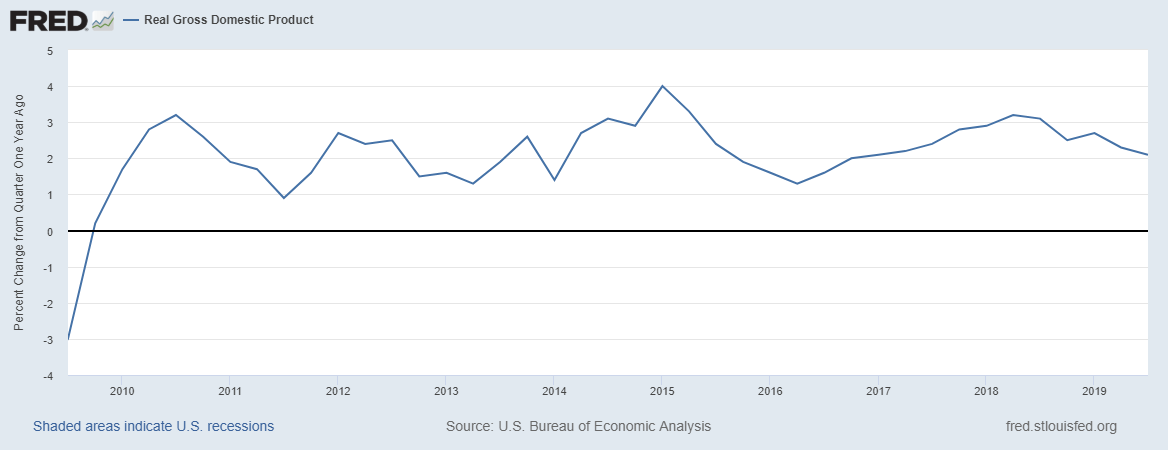
It was exactly one year ago that fears of recession galore were rampant through the Market place. Now a year later, we are no closer to recession today then we were then. The US economy grew at a respectful 2.1% in the third quarter. Meanwhile, most of the data we have gotten to this point in the fourth quarter is pointing to around 2.0% growth in the fourth quarter.
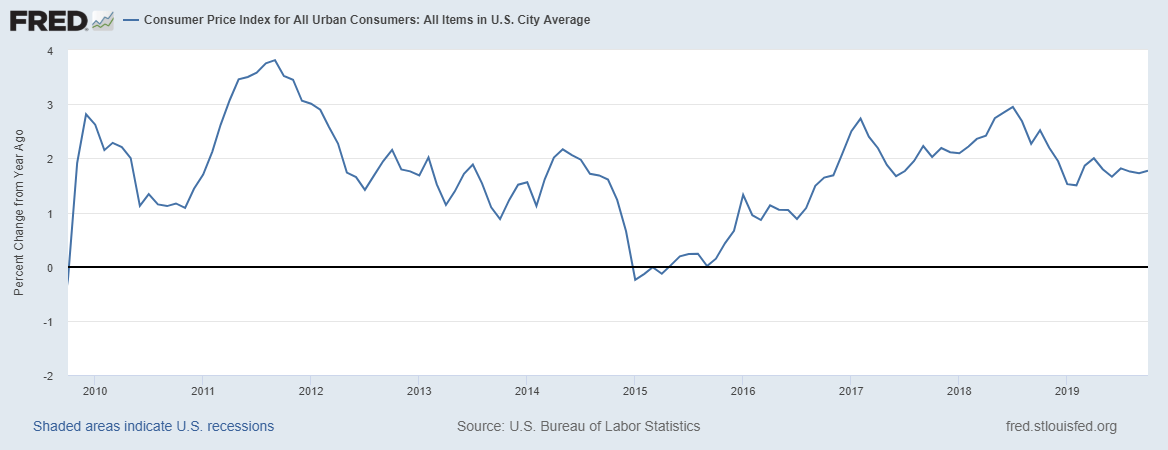
Consumer prices, remember the significant impact it was supposed to have on the consumer? Well, we are still waiting. Consumer prices have declined.
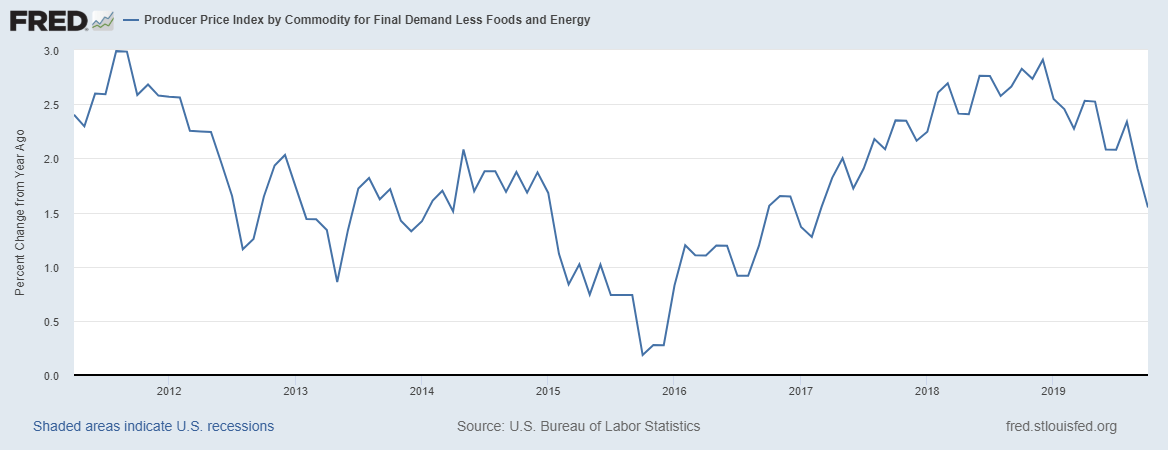
Maybe it because all the companies are absorbing the cost, and it is showing up in producer prices. Nope, not there either. Producer price ex-food and energy were up only 1.5% in October and have been falling.
So no price inflation, no recession, and tons of anxiety.
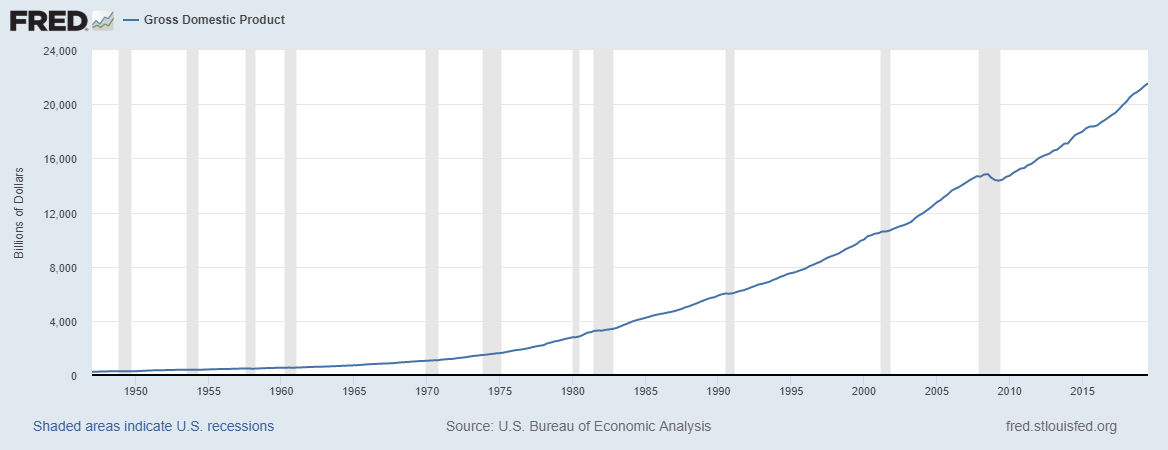
We have a nominal GDP of $21 trillion.
But yet, we are going to sink from a trade war with China, on what is now less than $500 billion of imports per year. Because the imports from China have been plunging in recent months, look at the chart below, I downloaded the data from St. Louis Fed and ran it in excel on a trailing twelve-month basis. Based on October’s data, imports fell to $486 billion from a peak of $540 billion in October of 2018.
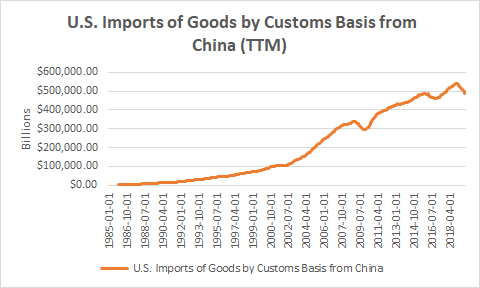
So put the tariffs at 50%, and we are talking about $240 billion in taxes, on a $21 trillion US economy, and it represents 1.1% of the entire US economy. Put it at 25%, and we down to 50 basis points, on a trade number that appears to be shrinking.
I didn’t believe the economy would tank from a trade war with China last year, and I most certainly do not believe one will sink the economy now. So lets all just get over it
Moving on…
S&P 500
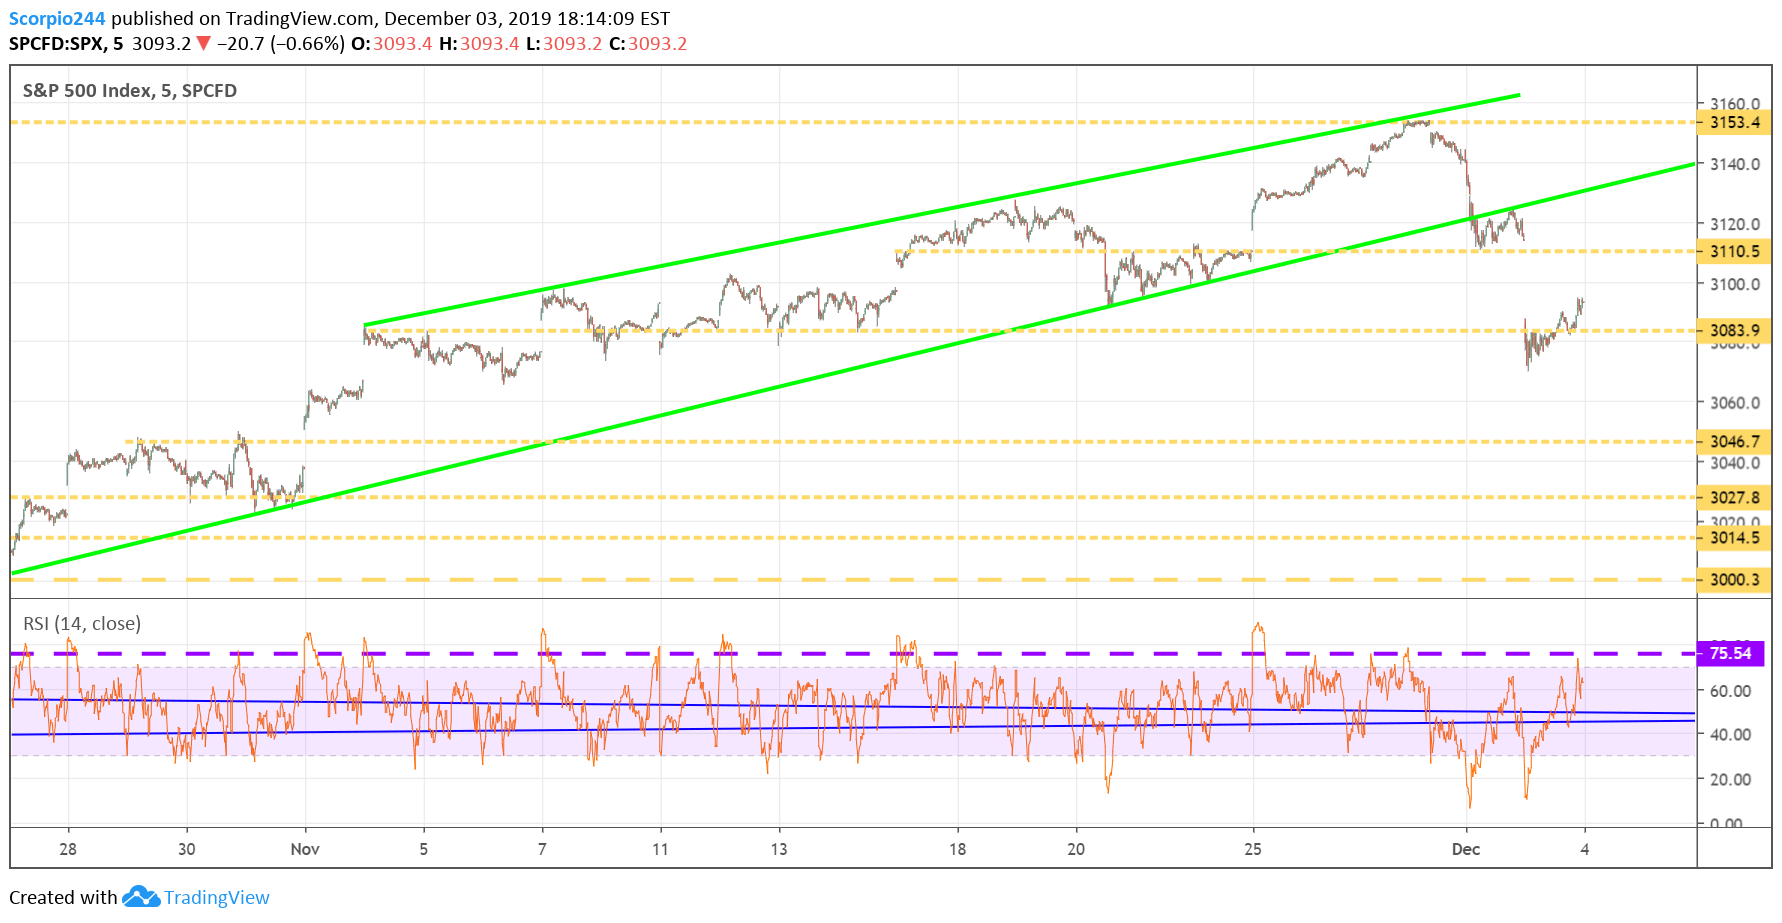
The S&P 500 fell to exactly where it was supposed to fall yesterday, as I noted Monday night, before the “trade fears” took the market by storm, to 3,080. That region held firm and bounced. Now there is a gap to fill up to 3,110 today.
Netflix (NFLX)
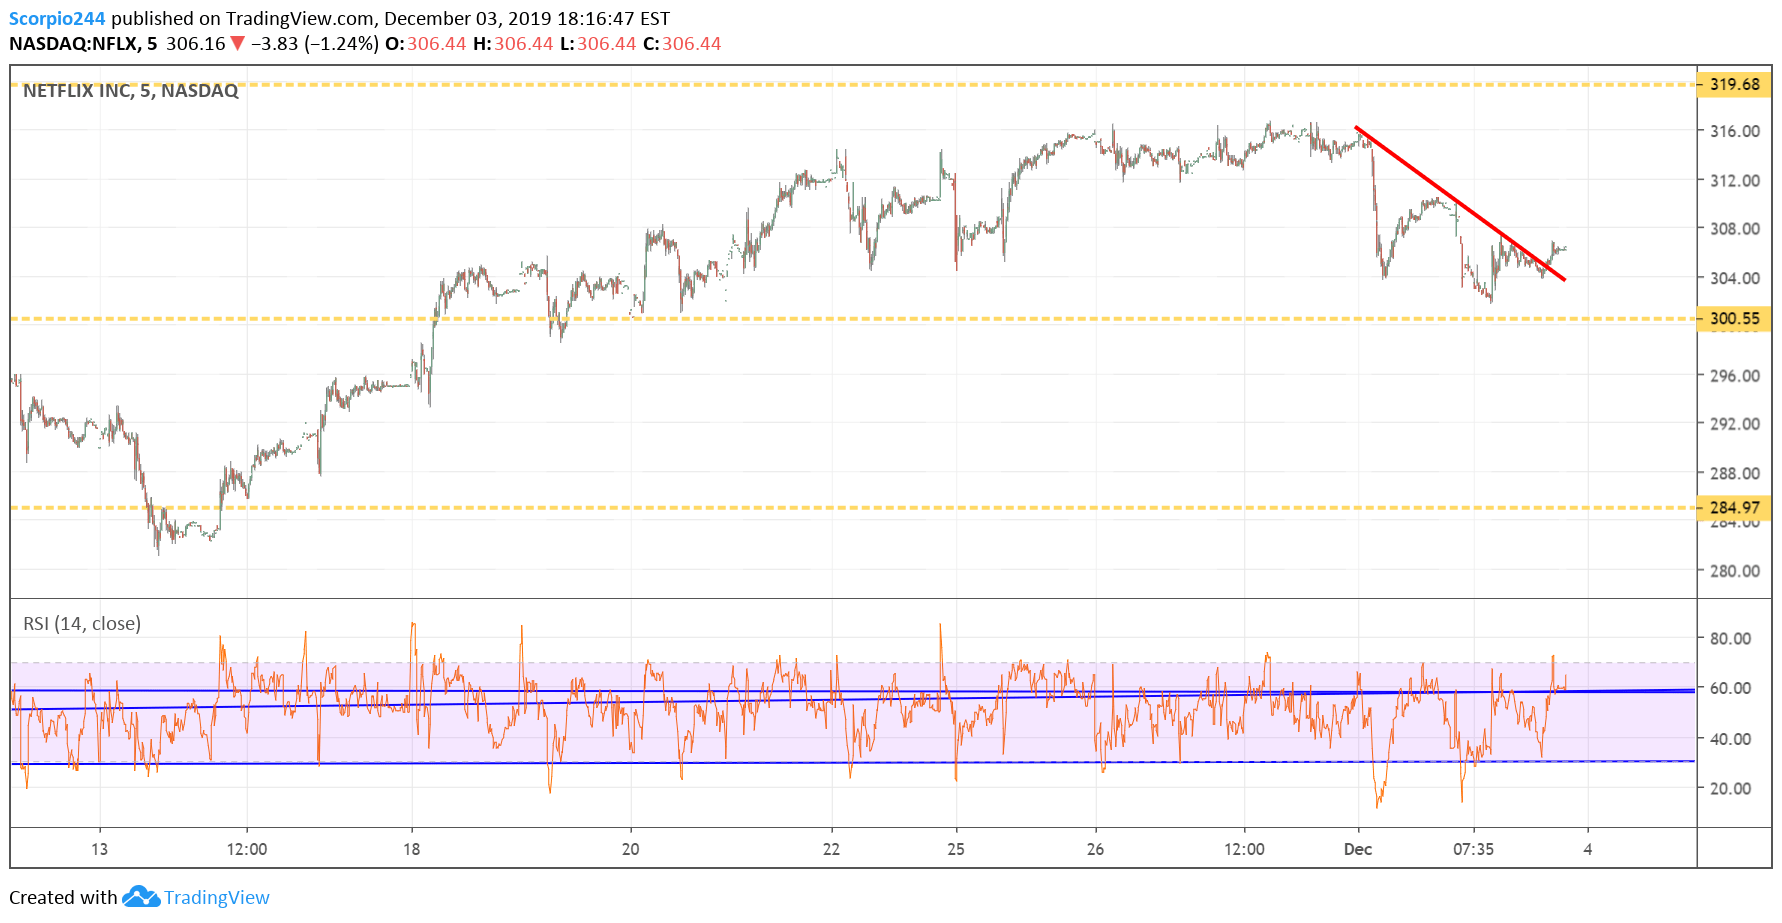
Last time I check, Netflix (NASDAQ:NFLX) was still not allowed in China, and now the stock is breaking a little mini-downtrend. $315 is a reasonable place for a rebound.
Apple (AAPL)
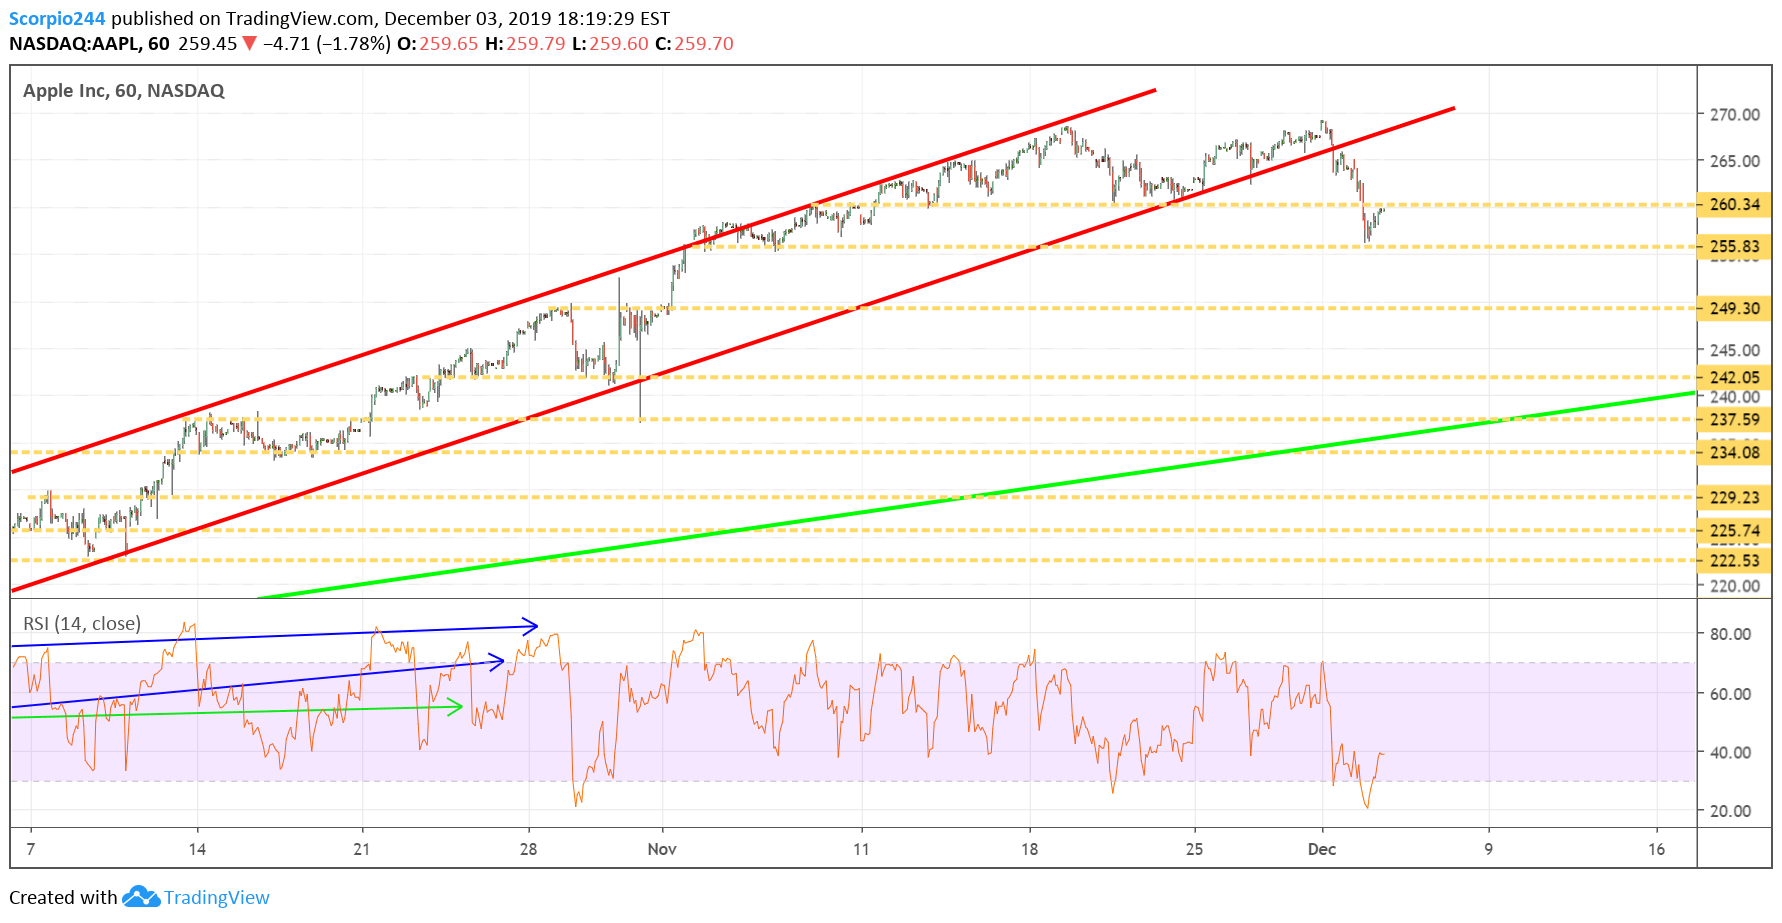
Apple (NASDAQ:AAPL) fell yesterday, but support was firmly at $255. That means that $260 is now resistance, with downside risk to the next support level at $249.
Qualcomm (QCOM)
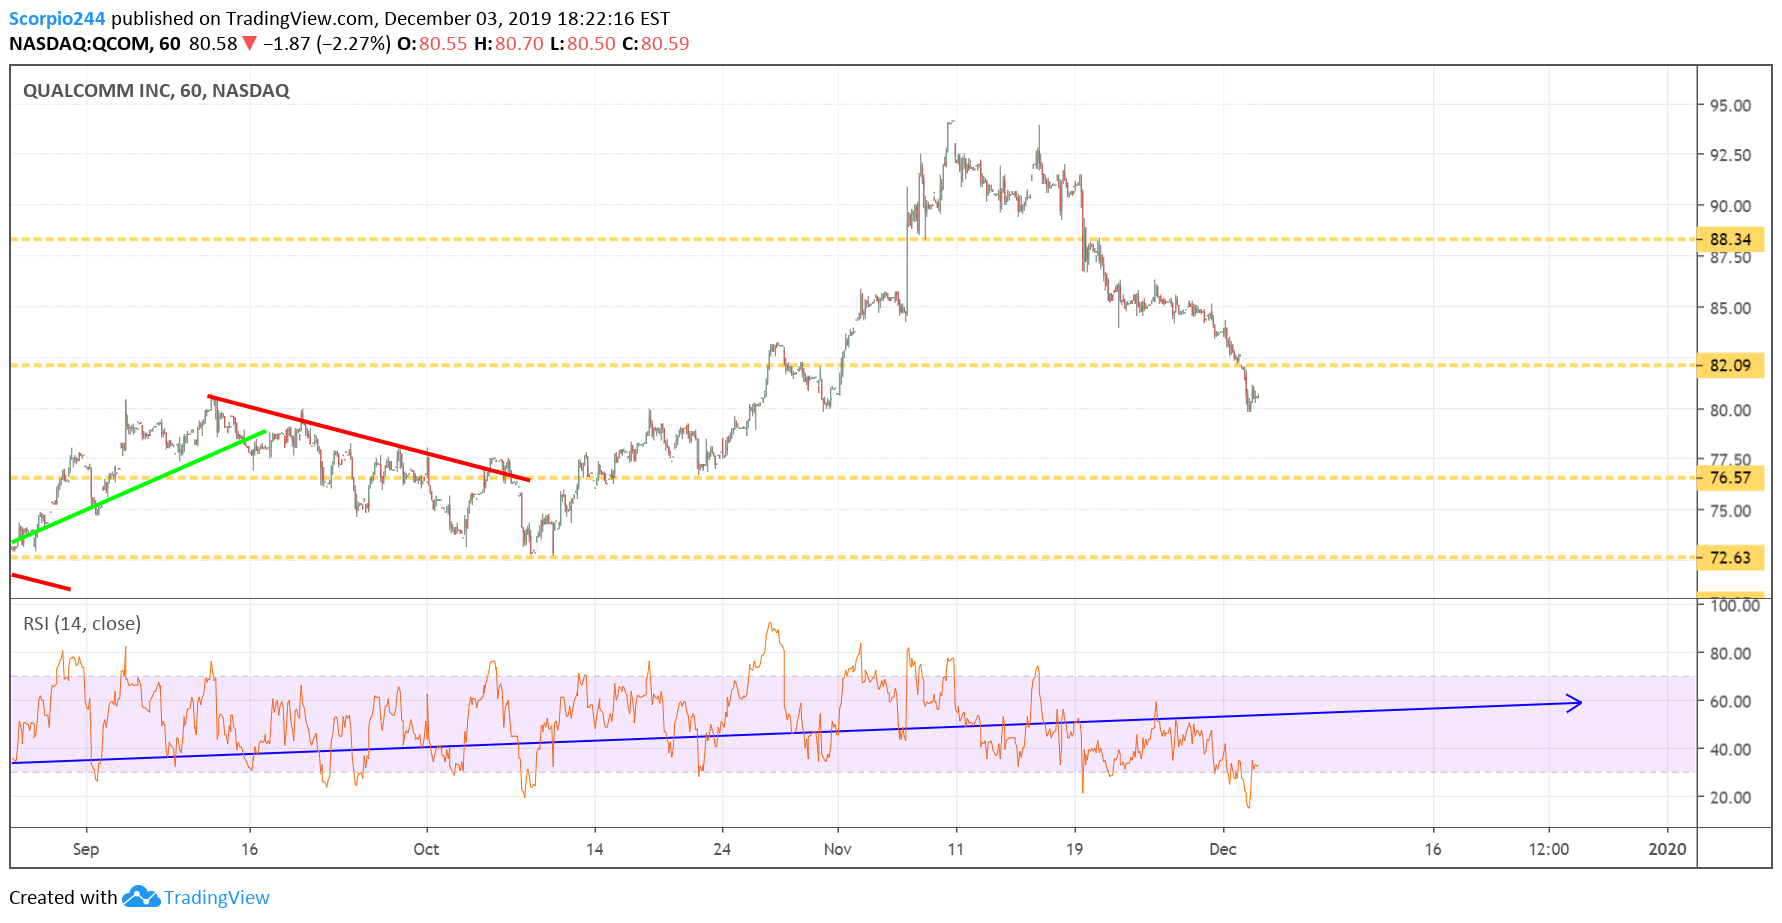
Qualcomm (NASDAQ:QCOM) fell below $82, and that level becomes resistance for the stock and opens the door for a decline to $76.50.
Micron (MU)
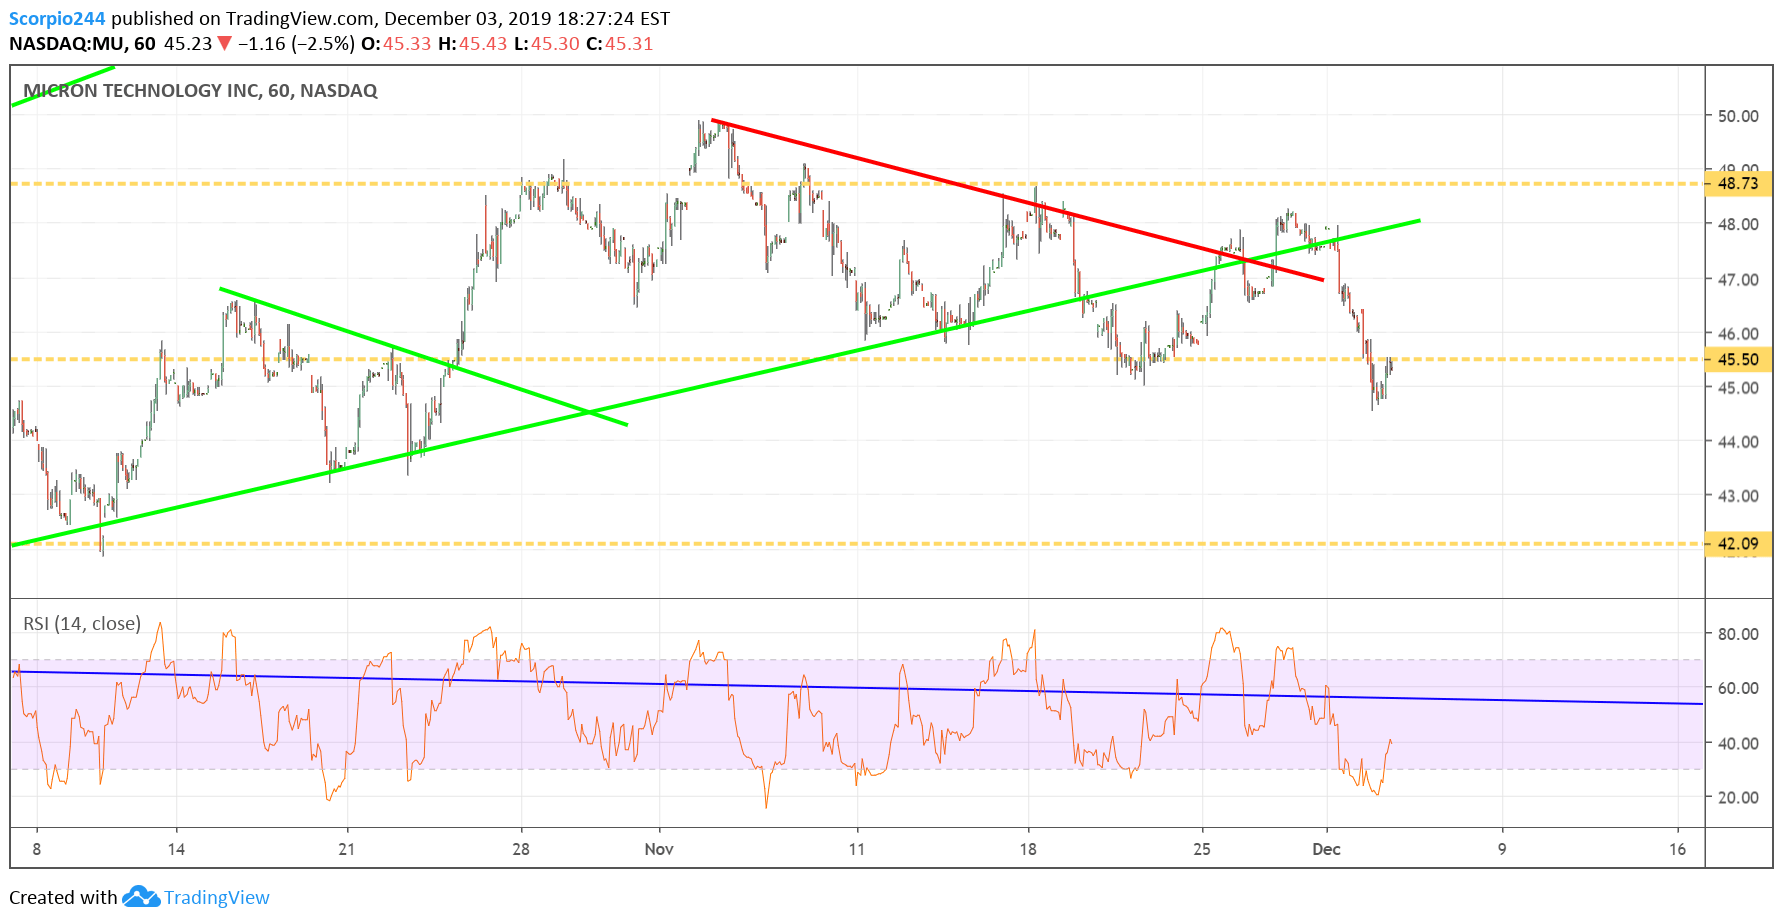
Micron (NASDAQ:MU) fell through support at $45.50 yesterday, and now that becomes resistance. It at least creates the possibility for it to drop to $42.
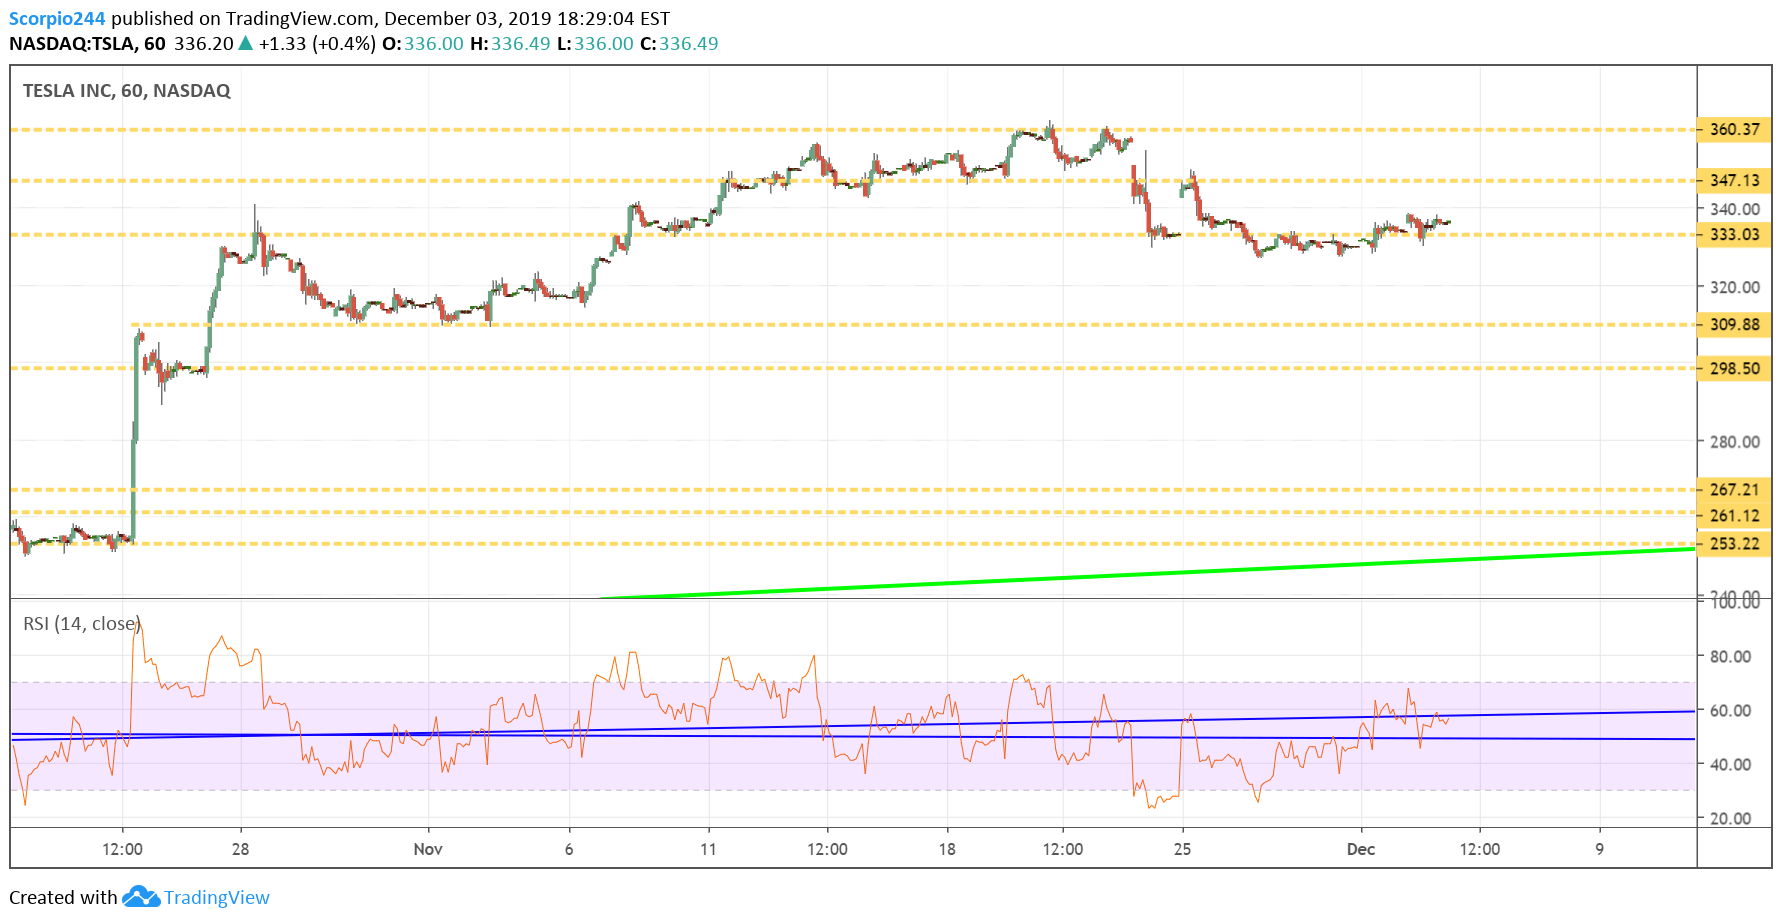
Tesla (TSLA)
Tesla (NASDAQ:TSLA) continues to perform well and is likely on its way back to $347.
