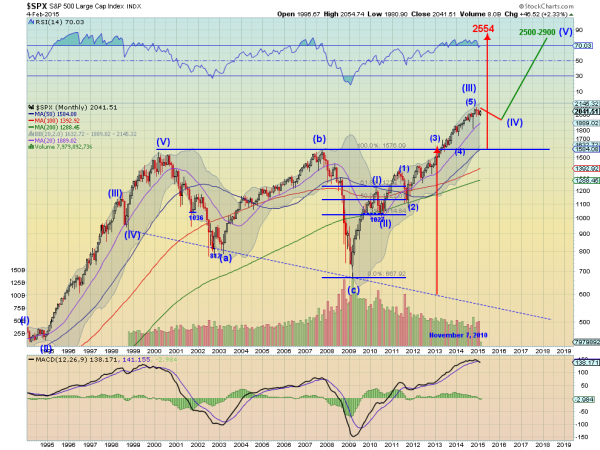
Despite what your parents or grandparents might say or what you might hear about on the nightly news, the S&P 500 long ago replaced the Dow as the benchmark for what is happening on the broad stock market. The Dow had its place when there were industrial transportation and utility stocks. But it is far too narrowly focused now. So I will end this series with the S&P 500.
The chart of the S&P 500 also has a lot to say, but it fits into four basic themes. The first is the big expanding triangle that the S&P 500 broke out above in May 2013. This triangle or wedge goes back to 1998, 15 years. That is a long broad consolidation pattern. There are two important levels that come out of that wedge. The first is the Measured Move. Looking at the move from the base a 450 in 1994 to the top of the wedge at about 1550 gives a projected target to 1750.
It did not even pause at this level. Strength. The second is the pattern projection out of the wedge. The wide end at the break added again higher targets 2554. It is not obvious from the log scale but the current pause is about halfway through the move to that level from the breakout. The perfect place for a bull flag to develop.

The second theme is the Elliott Wave pattern. The move to the top in 2000 at (V) completed a 5 wave impulse higher. The next 8 year saw a correct Wave pattern, and an new impulse wave began from the 2009 low. This will also have a 5 wave pattern alternating between those trending higher and corrective waves. Should the sideways motion in the S&P 500 over the past 4 months continue it would confirm the end of Wave (III) and the sideways motion as Wave (IV), a corrective wave.
Elliott Wave principals show that Wave (II) and Wave (IV) are often differing in character. So with Wave (II) as corrective to the downside one could anticipate Wave (IV) to move more sideways in the correction phase, like we are seeing. Wave (V) then could measure up to between 2500 and 2900. This comes from adding the length of Wave (I) or Wave (III) to the Wave (IV) bottom at about 1900.
The 1900 level comes from the third theme, the Fibonacci extension of the last leg of the correction from (b) to (c). A 138.2% extension of that leg to the upside reaches to 1922. This is what was used as a pullback target for Wave (IV). The other important Fibonacci extensions, 150% and 161.8% are at 2029 and 2136. The high on the S&P 500 to date at 2093 falls short of the 161.8% extension, but the span from the 138.2% to 161.8% levels has developed a range for the present. A move over the top would signal the end of Wave (IV) and start of Wave (V).
The final theme is the overbought momentum indicators. The RSI has been in overbought territory since May 2013. It has stayed in that area longer, from 1995 to 1998, but each time has triggered a pullback. The analysis above suggests the pullback might be shallow this time, different than the previous two times. But a move under that 1922 level would suggest a deeper correction. The MACD is also in pullback or consolidation mode. it is crossing down, a sell signal for those that trade off of the indicator.
The accumulation of these views forms a mosaic of a broad market set to move sideways for a while before ramping to much higher levels. A move over 2150 would suggest that the consolidation is over and the upside is resuming. And as mentioned earlier, a move under 1922 would suggest the correction will get deeper. In that case a retest of the 1576 breakout would be the target.
Disclaimer: The information in this blog post represents my own opinions and does not contain a recommendation for any particular security or investment. I or my affiliates may hold positions or other interests in securities mentioned in the Blog, please see my Disclaimer page for my full disclaimer.
