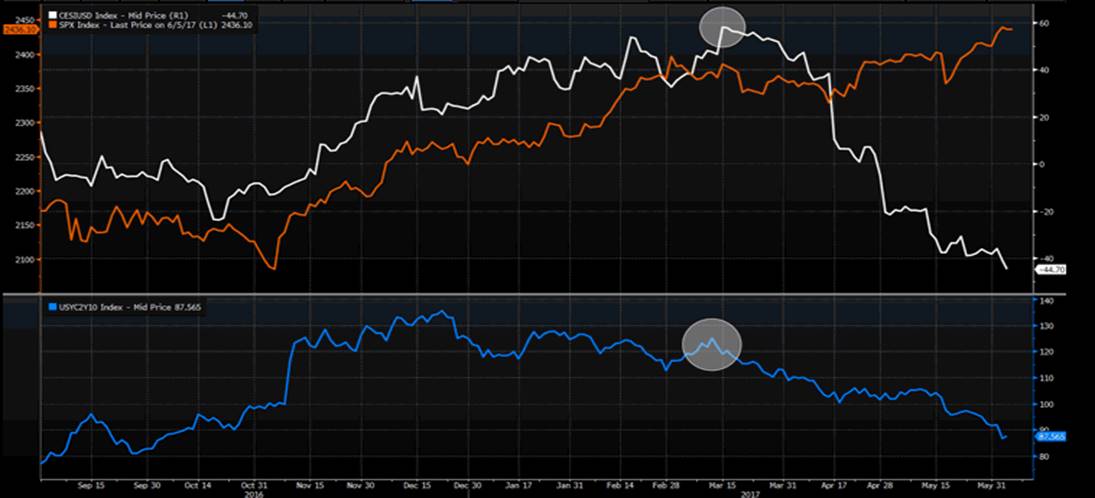
If you like low volatility in equity indices then the overnight session took the first prize in delivering absolutely no move whatsoever. Tough times then for the traders who like a market that shows signs that market participants actually have an ability to move prices around, but what we saw was a measly five-point range in the S&P 500 and 56-point range in the Dow.
Looking within the S&P 500 sectors, we can see energy the best performer with a gain of 0.2%, while utilities fared the worst with a drop of 0.5%. While sitting in the office in Melbourne it feels as though there should have been tumbleweed in the New York Stock Exchange, although volumes were 16% below the 30-day average (on the S&P 500), which is low, but not terrible. Again, this is life as we know it with the US volatility Index (“VIX”) below 10%.
US data has come in largely below expectations, which is a theme we seem to be saying a lot at the moment. The May ISM service index came in at 56.9, which was a solid number and showing good expansion in the service sector, although it did miss forecasts and was a slight slowdown from the April print. Both the new orders and new export orders sub-component of the index detailed a strong slowdown in the pace of expansion, although we saw this being offset (to an extent) by a strong increase in employment component. Factory orders (-0.2%) and durable goods (-0.8%) were wholly uninspiring as well, but there has been a limited reaction across the US Treasury curve and subsequently no real move in the USD.
So the view remains unchanged that the Federal Reserve hike next week, but if this trend of deteriorating US data does not show improvement and the US yield curve subsequently continues to flatten then I really feel we are going to start to see a pick-up in equity market volatility. It seems unsustainable that this divergence between US data trends and continued all-time highs in US equities continues.

Asian markets will feed off the limited moves seen overnight and will likely open unchanged. The Aussie index has become somewhat less predictable, at least to forecast moves after the unwind of the auction (at 10:10 aest) and I for one didn’t expect to see the sell down we saw in the ASX financial sector on open yesterday and it felt like a fund was dumping a decent chunk of their holding, but on second blush we can see a strong correlation with the Aussie yield curve (the difference between Australian two-year government bonds vs ten-year bonds). We saw this yield spread differential trade into the lowest (or flattest) since November yesterday and the banking sector came along for the ride. However, given what we have seen in the US overnight one suspects the Aussie yield curve stays largely unchanged today and banks, therefore, open on a flat note.
One variable that could change this could be when we see the Q1 balance of payments at 11:30 aest, with net exports as a percentage of GDP expected to provide a 40 basis point headwind to tomorrow's Q1 GDP print. After all the other inputs of late, it feels the 0.3% qoq consensus growth estimate feels right, perhaps with some upside risk of say 10bp (to 0.4%), but today’s data is the final missing piece and should see economists tweak their models and provide a final estimate ahead of tomorrow’s data. Given the Q1 inventory and company profits data one feels a contraction on the quarter now would be a decent surprise to the market and could cause a 50 pips or so downside move in AUD/USD, obviously depending on the actual outcome.
Interestingly, we have seen a solid session for the AUD and it has rallied against all G10 currencies. AUD/USD has traded in a fairly wide range of $0.7499 to $0.7412, however, the bigger moves have been seen against the Scandinavian currencies, while EUR/AUD has also seen a reasonable pullback and well traded. The four-hour chart of EUR/AUD looks interesting and I would specifically be looking over the next couple of days to see how price reacts on moves into a$1.4940 to a$1.4911. It seems likely any further selling into this support zone will be driven more prominently by disappointment from the ECB meeting on Thursday (21:45 aest) than today’s Aussie GDP or Reserve Bank statement, which should once again be broadly neutral and unchanged from the May statement. I like the idea of buying pullbacks in EUR/AUD into this support zone.
In terms of leads from commodities, we can see spot iron took a hit, closing 3.3% lower, although we have seen stable conditions in Dalian iron ore futures. Steels futures though closed 2% lower. Perhaps the bigger talking point are the rising tensions among the Gulf states (and Libya) and key OPEC members and although traders initially bought US crude and Brent, moves were quickly sold and we actually now see US crude now 1.7% lower from the ASX 200 close. BHP’s American Depository Receipt followed closing down 1% and we can see Vale’s US-listing closing down 2%.
