They say ‘never short a dull market’ and this is about as dull as it gets with such low implied volatility in FX, fixed income and equities. That being sad, there are still great opportunities to improve one’s equity curve and for fund managers to drive alpha.
One area of interest has been Snap (NYSE:SNAP), where IG are now offering shorting and as things stand some 59% of all open positions held by clients are now held on the short side and looking for a move lower. Some express concern on valuation, others point to a decline in monthly active user growth, but there has certainly been a healthy scepticism that the share price can hold its opening IPO price of $24 and that seems to be playing out well.
One can always expect some volatility in a name like SNAP as the market tries to find an equilibrium and ‘fair value’ after a well-publicised launch.
Elsewhere, there has been some discussion that the Atlanta Fed have lowered its Q1 GDP forecast to 1.3%, which seems far too low for an economy expected to hike three rate hikes this year. Let’s not forget that the model has been a poor predictor in recent quarters, but a number of investment banks have also lowered their growth forecasts as well to around 1.6% or so after the January trade deficit increased from $44.3 billion to $48. 5billion.
Importantly, the trade data matched the street's expectations and despite the moves from some economists to cut growth forecasts, there hasn’t really been any reaction in markets. The Bloomberg calculation on the probability of a March Fed hike sits at 98%, while the CME calculation sits at 84.1%. Interest rate traders are simply not trading around this meeting anymore and see it as a done deal and we can see a real lack of volume in the April fed funds future contract.
The five-year U.S. treasury has actually gained a couple of basis points at 2.04%, while the 10-year stay at 2.51%. Importantly, we still see negative ‘real’ (i.e. inflation adjusted) interest rates and this has been the case since 3 January and as long as this remains in play then markets will not be overly concerned with the Fed hiking, as financial conditions remain accommodative.
There will be some focus on the ADP private payrolls at 00:15 aedt tonight, with economists looking for 189,000 jobs to be created in February, which is a slower pace of job creation from the 246,000 jobs we saw in January. This could set a tone for Friday’s non-farms payrolls, so all eyes on the reaction in fixed income and USD/JPY specifically looks interesting, especially if we can see more upside and a break of the double top at ¥114.95.
U.S. equities have again provided very little lead for Asia and SPI futures are currently lower by 14 points. We expect to see the ASX 200 open around 5745, with BHP’s ADR lower by 1.4%. There is seemingly a lack of drivers for the market today, with spot iron ore unchanged, and very modest downside moves in iron ore, coking coal and steel futures (on the Dalian exchange). Copper is perhaps the bigger mover down 1.3%, while gold sellers have been pretty active and judging by the price action and the technical set-up the bias has shifted to one of higher downside probability and selling rallies for a potential target of $1180.
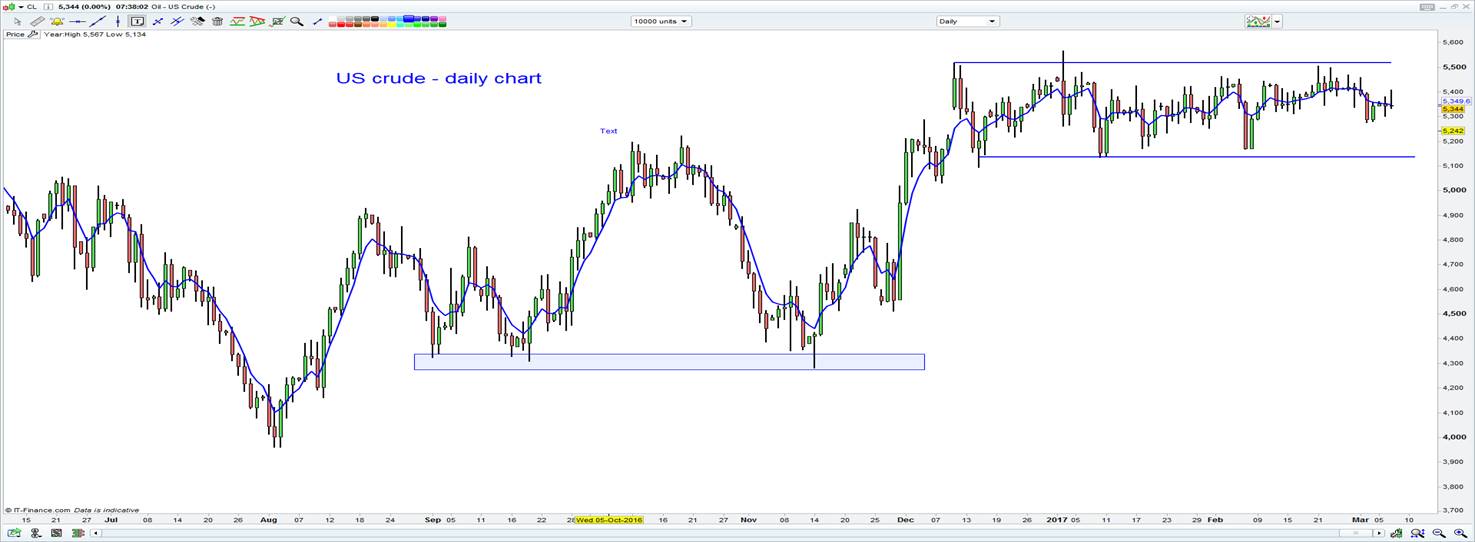
U.S. crude is lower by 0.2% and the focus will be firmly on tonight’s (02:30 aedt) weekly Department of Energy (DOE) inventory report, with expectations of a build of 1.148 million barrels. Gasoline, often a stronger influence on price than crude inventories are expected to see a draw of 1.58 million barrels. Comments from the Saudi oil minister overnight have supported price, with further details on adhering to agree output cuts, however, I thought the comments about having not yet decided “what to do with second half output cuts” were more interesting.
As we head into 25 May and the next OPEC meeting there could be increased volatility in crude, especially if the market forms a consensus that the agreed cuts will not be rolled over into the second half of the year. That’s when U.S. crude breaks out of this side-ways pattern it has been in since 11 December (57 trading sessions) and the $55 to $51.50 range.

There is still much focus on yesterday’s Reserve Bank statement and the slight tweaks in language. The market has not really changed in its pricing mechanism and expect a 52% chance of a hike over the coming 12 months, and the idea of the cash rate coming down to 1% is looking more and more like a pipe dream and anyhow the barriers to cut are just so high now. Some focus has been on positive commentary around investment and consumption, with UBS also suggesting:
There is little doubt the recent re-acceleration in housing lending and prices raises the risk the current record low cash rate – arrived at during a prior deflationary environment (mid-16) – might now just be too low.
AUD/USD traded up to $0.7632, but has dropped back below the 76 handle and price action looks actually quite bearish, with the daily candle showing the bears wrestled back control with some ease. The two-hour chart shows a bear flag pattern and a break of $0.7586 suggests the pair heads lower. A level for the radar.
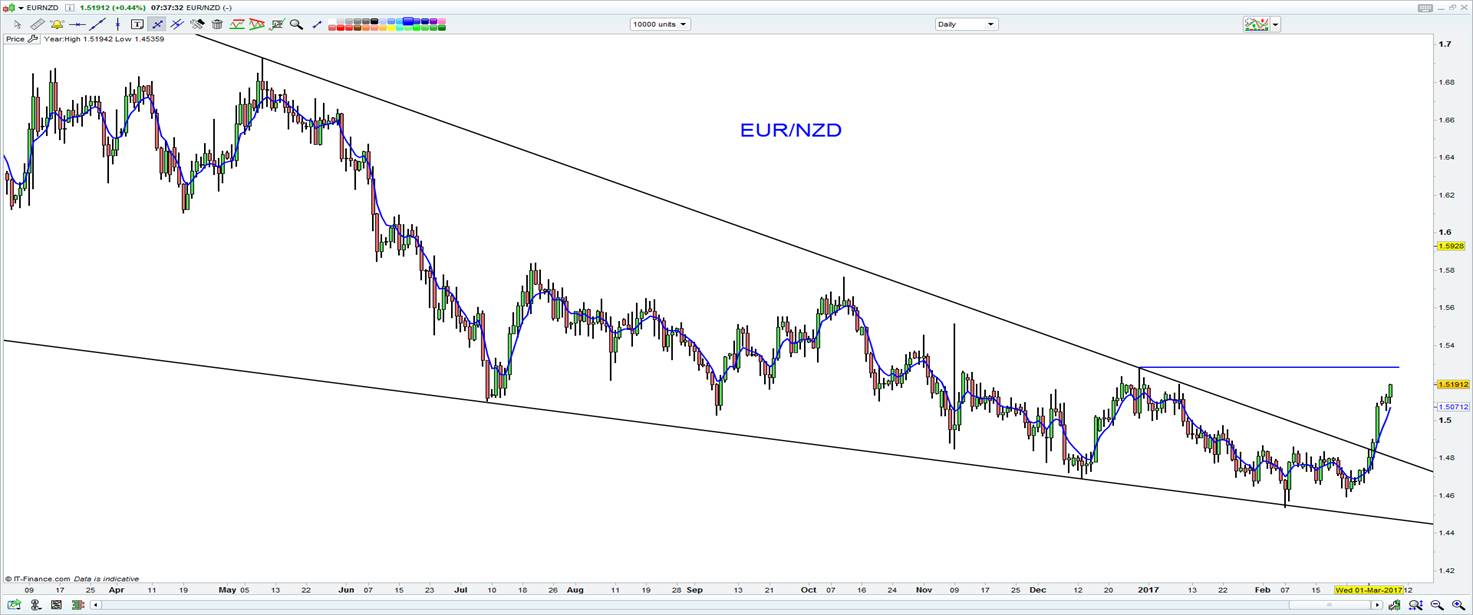
My EUR/NZD long trade idea is working well and is almost a textbook reaction to the recent technical break.

