The focus remains on U.S. equity markets, with the S&P 500 grinding higher yet again amid solid gains in financials, tech and industrial names. However, it’s certainly positive to see the Russell 2000 join the party with new all-time highs.
Pullbacks in U.S. equities will be bought and this market grinds higher, at least in the short-term, in my opinion and the trade is to be long and trail the stop up when the market moves higher. Perhaps that changes when we get further details on this ‘phenomenal’ tax reform (buy the rumour sell the fact anyone?), but few funds want to really be short the market with any conviction ahead of the impending announcements.
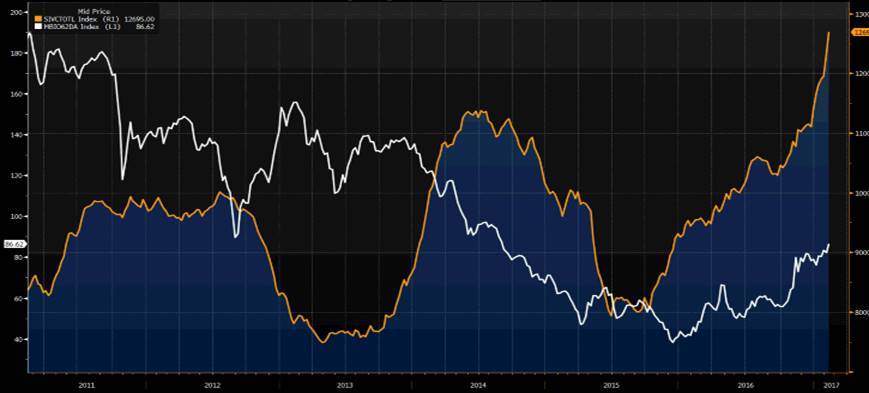
The other area which has garnered more attention has been the moves in Chinese markets. On the commodity side, we can see another sizeable move in bulk commodities, with spot iron ore + 6.5%, while iron ore futures (traded on the Dalian exchange in China) traded +1.5% to RMB710.5. Steel and coking coal futures have gained 0.8% and 0.9% respectively too.
The fact we have seen stockpiles of iron ore at Chinese port increase to a new 10-year high of 127 million tonnes (+2.8% on the week) is certainly helpful. But then you also hear that the Chinese Ministry of Environmental Protection has proposed a draft to further cut steel and aluminium producers (source: Reuters) by as much as 30% in 28 cities across five regions, and this is like a red rag to a bull for the speculators.

As Rio Tinto (NYSE:RIO) CFO Chris Lynch said overnight iron ore prices are not expected to ‘fall off a cliff’. If holding a pure play commodity name this is the purple patch. By way of a guide, Cliffs Natural in the U.S. is up 8%.
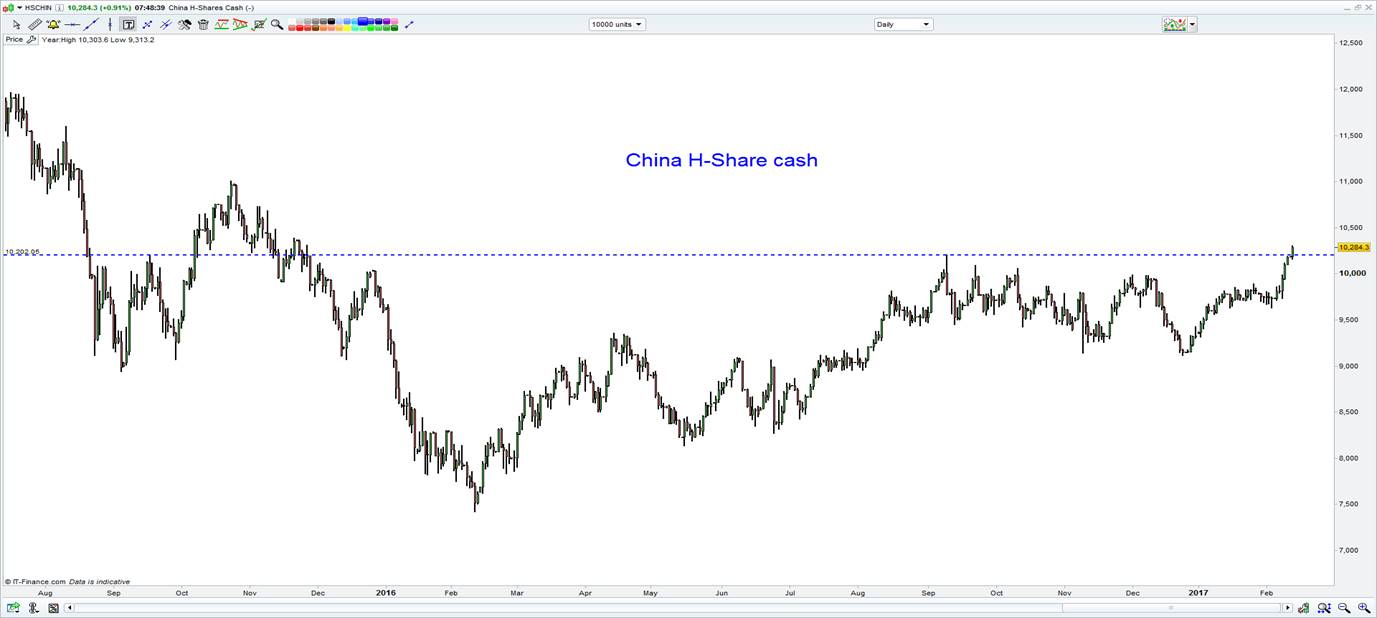
Chinese equities are finding buyers too and the market traders should look at above the others (in my opinion) is the H-shares index. This is effectively Chinese mainland companies listed in Hong Kong. In the last week or so flows through the Northbound-Southbound ‘connect’ have been strong, with good demand from Chinese mainland traders to purchases these ‘offshore’ listings.
The fact we have seen the PBoC restart its 7- and 14-day repo operations, thus promoting the idea that liquidity will be abundant is helping here too. The fact is the H-share index has broken out of the September 2016 highs and is the best levels since November 2015. Stay long this index, with a fairly aggressive stop through yesterday’s low of 10,154.
Remember, when Chinese markets trend they are some of the best momentum and trend following markets out there.

In Australia, we should see further gains in the equity market with SPI futures pushing up 19 points (or 0.3%) in the night/SYCOM session to currently sit a 5731. Our ASX 200 cash opening call currently sits at 5785, so just shy of the target of 5800, but given the market internals, positive sentiment (yet not euphoric) and trend I suspect we break 5800 fairly soon and eye a push into the year's highs at 5827 (or 5790 in the futures).
Equity traders will be focusing on numbers from COH, CGF, GPT and TWE, but the short-term traders will likely be looking at COH above the others given the trend and implied volatility in this name. COH has rallied 19% since the reversal on 7 December and had every opportunity to roll over yesterday, but the buyers stepped in and showed absolutely no concern for holding the name ahead of earnings today.
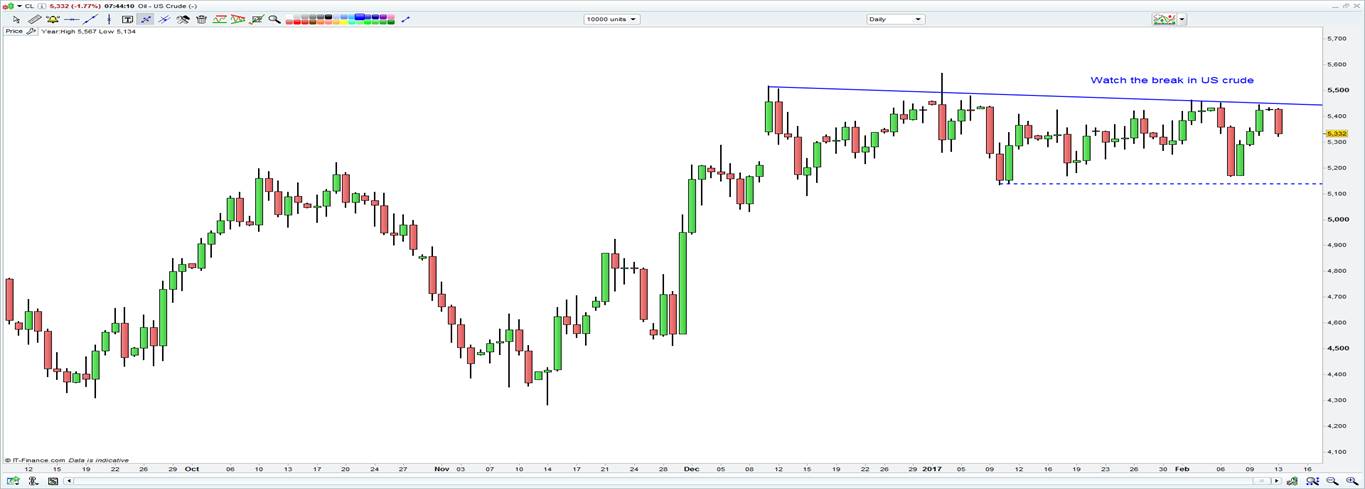
Keep an eye on the banks with CBA reporting tomorrow, although as things stand CBA’s ADR suggests only a slightly stronger open. WPL’s ADR is largely unchanged despite U.S. crude falling 1.9% on the session, despite the Saudi’s detailing they had cut output by the most in eight years. It’s interesting to look at the daily chart of crude where we seem to have seen strong technical selling as price moved into the December downtrend resistance which sits at $54.50. Oil bulls will want to see this trend break and price to push through the 2 February highs too, then we should see new highs in the recent consolidation pattern.

Aside from earnings, the event risk is fairly limited to NAB business confidence and Chinese inflation data. I suspect AUD/USD won’t be too affected by the Aussie confidence read and the market is still very happy to range trade this pair for now. On the China data, the market expects a 30 basis point increase in consumer inflation and a sizeable 100 bp (or 1ppt) to producer price inflation. The moves in producer price inflation have been staggering and fantastic if you are a price maker and an upstream provider, not so good if your business consumer heavy levels of raw materials and you are unable to pass on the costs.
Which stock should you buy in your very next trade?
With valuations skyrocketing in 2024, many investors are uneasy putting more money into stocks. Unsure where to invest next? Get access to our proven portfolios and discover high-potential opportunities.
In 2024 alone, ProPicks AI identified 2 stocks that surged over 150%, 4 additional stocks that leaped over 30%, and 3 more that climbed over 25%. That's an impressive track record.
With portfolios tailored for Dow stocks, S&P stocks, Tech stocks, and Mid Cap stocks, you can explore various wealth-building strategies.
