Investing.com’s stocks of the week
Given how little it's used, Gold Miners Bullish Percent Index is an almost secret indicator, but that doesn't mean it's of little value to gold investors. Quite to the contrary.

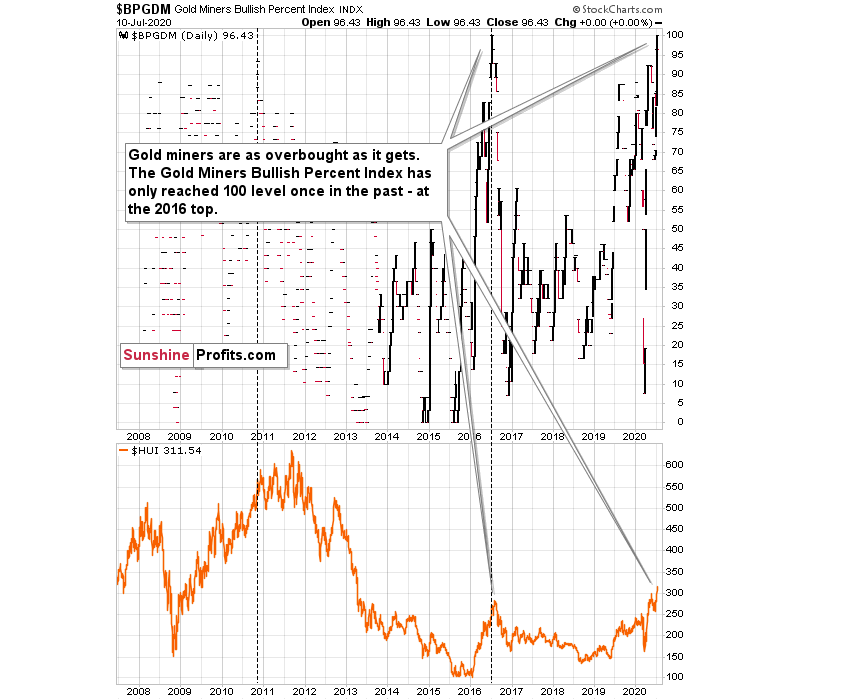
As you can see, the miners just flashed an "extremely overbought" signal, which they had only flashed once in the past - almost right at the 2016 top.
The Gold Miners Bullish Percent Index recently moved to the highest level that it could reach - 100.
The only other case when the index was at 100, was in mid-2016.
We marked this situation with a vertical dashed line. Did miners continue to move higher for a long time, or did they move much higher? No.
Precisely, the index reached 100 on July 1st 2016, and gold mining stocks moved higher for two additional trading days. Then they topped. This was not the final top, but the second top took miners only about 5% above the initial July high.
This year, the index reached the 100 level on July 2nd - almost exactly 4 years later, and once again practically exactly in the middle of the year. Miners seemed to have formed the intraday high on July 9th - four trading days later.
It's not justified to assume that the delay in the exact top would be 100% identical, but it seems justified to view it as similar. Two-day delay then, and four-day delay now seem quite in tune, and this similarity supports a bearish forecast for gold.
There's also one additional point that we would like to emphasize and it's the previous high that the index made on November 9, 2010. That was the intraday top, so there was no additional delay. There was one additional high about a month later, in December, but miners moved only about 1.5% above the initial high then.
One might ask if mining stocks are really overbought right now given the unprecedented quantitative easing, and the answer is yes. Please note that in 2016 the world was also after three rounds of QE, which was also unprecedented, and it didn't prevent the miners to slide after becoming extremely overbought (with the index at the 100 level). The 100 level in the index reflects the excessive optimism, and markets will move from being extremely overbought to extremely oversold and vice versa regardless of how many QEs there are. People tend to go from extreme fear to extreme greed and then the other way around, and no fundamental piece of news will change that in general. The economic circumstances change, but fear and greed remain embedded in human (and thus markets') behavior. Taking advantage of this cyclicality is the basis for most (if not all) trading tips for gold and other markets.

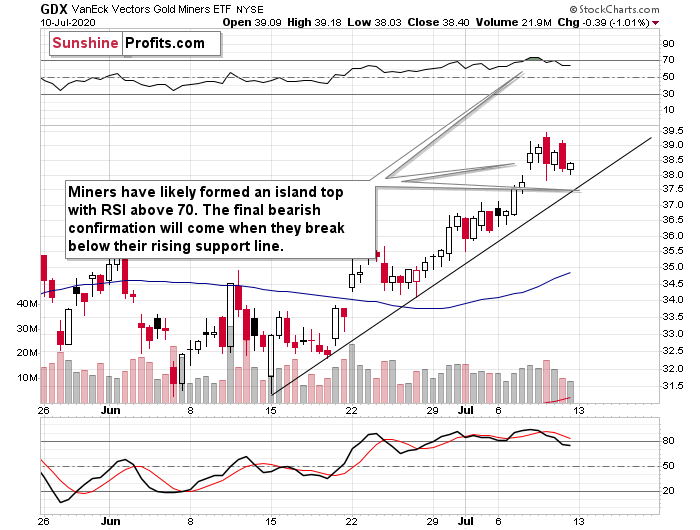
GDX (NYSE:GDX)'s 4-hour candlestick chart shows that they were just very overbought also from the short-term point of view as the RSI indicator moved above 70. While it was in this sell-signal territory, miners were moving back and forth after a bullish price gap. A combination of both suggests that what we saw, was an island top formation. At this time, it's just a "potential" formation, because we won't know for certain until miners decline more and move below the $37.5 level. This level is important because it corresponds not only to the lower border of the price gap, but it's also where the rising support line currently is.
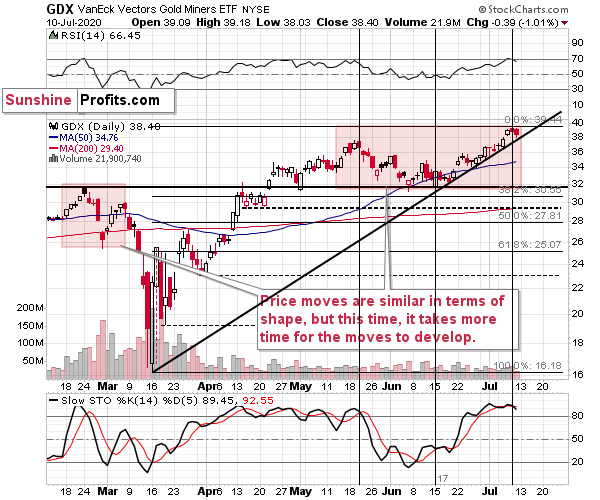
The strength of the support line - and thus the importance of the potential breakdown below it - is further increased by what we see on GDX's daily chart.

That's actually the line that starts all the way at the March bottom. Breakdown below this line would open the door wide open to strong declines. Given the Gold Miners Bullish Percent Index's extreme overbought reading, the fall should be substantial.
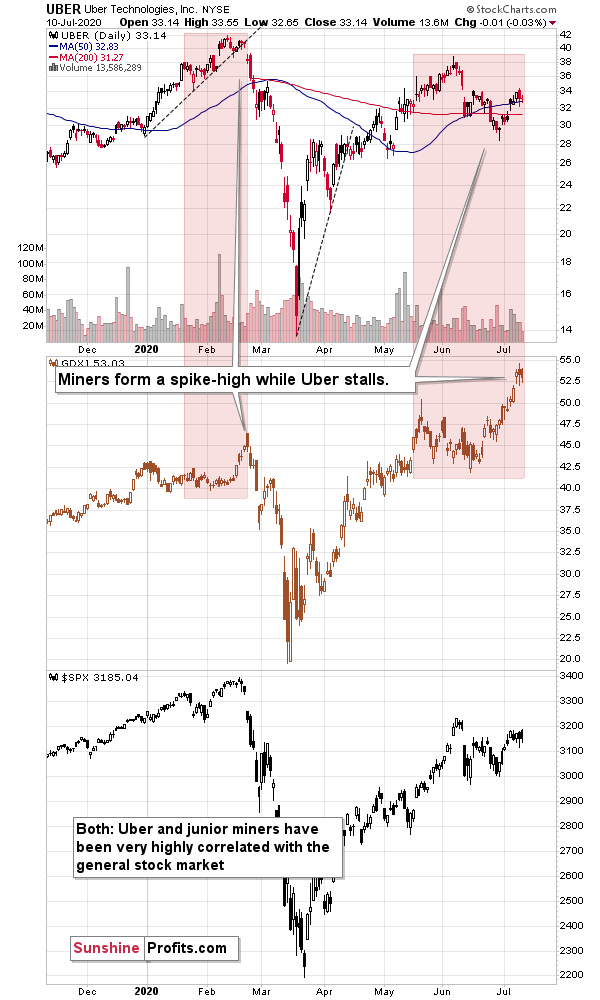
Finally, we would like to show you something interesting that you almost certainly won't see anywhere else. The comparison between the performance of the Uber (NYSE:UBER) stock and the junior miners. Why would we compare them? Because they are both very highly correlated with the general stock market, but the shape in which they move relative to the general stock market (and to each other) is very specific. It can tell us in what stage of the move the market really is.

Uber is particularly interesting because it's directly related to the current pandemic. When people are afraid of the coronavirus, they will think twice before using Uber's services. First, because they will prefer to stay home, and second because they will prefer to travel using more solitary means than by taking a cab, which was likely just used by someone else.
The thing is that Uber was early to disappoint and lag the market in March (underperforming the general stock market - please note how the final high in the S&P 500 didn't trigger an analogous move in the Uber stock), while the junior miners performed particularly well right before the top. The late-February spike was clearly visible.
Now, what's been taking place recently? The Uber stock is lagging, and it just failed to move to a new short-term high, while the S&P 500 did exactly that, and at the same time we see a sizable spike in the prices of junior miners. That's exactly what happened in February right before the slide.
This time, we also have bearish support from gold's long-term turning point, and we have miners which just showed an extremely overbought reading. The implications are very bearish.
