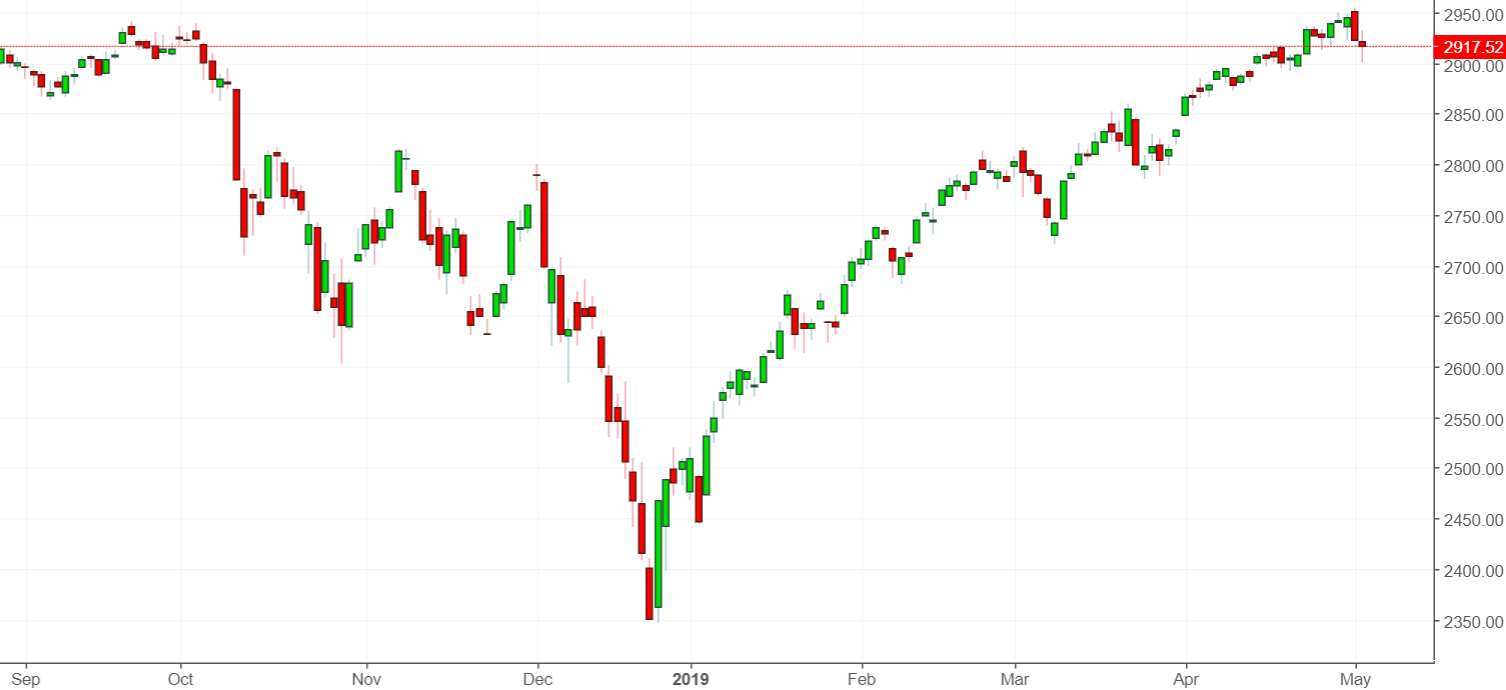
While the S&P has been in a steady uptrend and was recently at new highs, various indices have lagged significantly. The last time this happened was October 2018, just before the stock market crashed -20% in 3 months.
Go here to understand our fundamentals-driven long term outlook.
Let’s determine the stock market’s most probable medium-term direction by objectively quantifying technical analysis. For reference, here’s the random probability of the U.S. stock market going up on any given day.
NYSE
While the S&P 500 was recently at all-time highs, the broader NYSE Composite was still below its January 2018 highs. And look, this is “just like September 2018!”
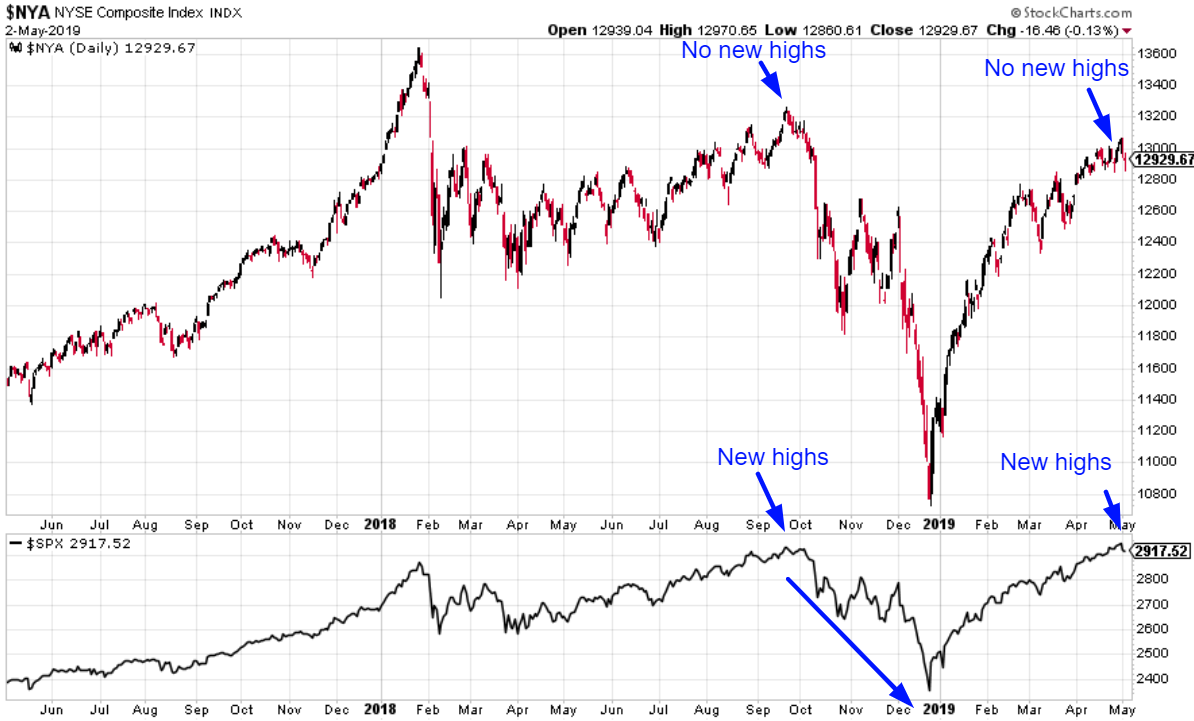
To avoid recency bias, let’s look at all the historical cases in which the S&P was at a 2 year high while the NYSE Composite was more than -4.5% below its 2-year high.
*Data from 1965 – present
You can see that this is rare, but not unprecedented. Moreover, this has only happened over the past 20 years. What changed?
From Wikipedia:
Over 2,000 stocks are covered in the index, of which over 1,600 are from United States corporations and over 360 are foreign listings; however foreign companies are very prevalent among the largest companies in the index: of the 100 companies in the index having the largest market capitalization (and thus the largest impact on the index), more than half (55) are non-U.S. issues.
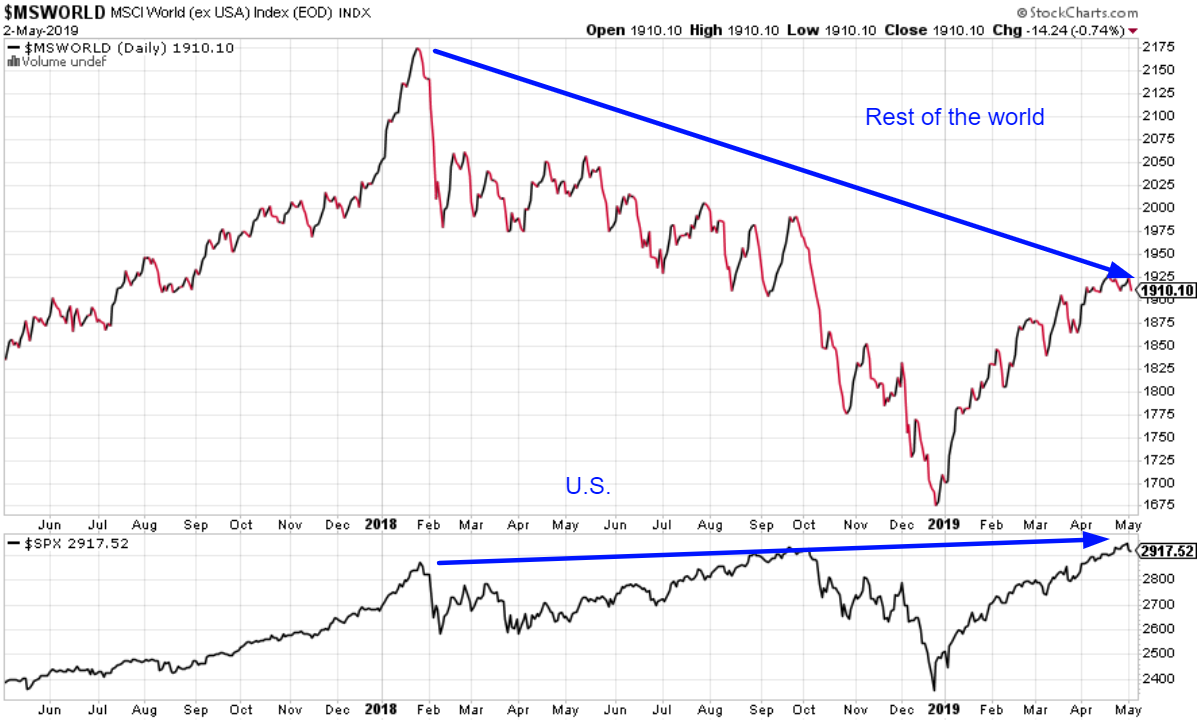
So there you have it. The reason why the NYSE Composite has “diverged” from the S&P is that more and more foreign stocks are included in the NYSE Composite. The NYSE Composite no longer best represents the U.S. stock market. Over the past 2 years, foreign stock markets have significantly underperformed the U.S.
Banks
Like foreign stocks, financial stocks have significantly underperformed the S&P over the past year, “just like in September 2018!”
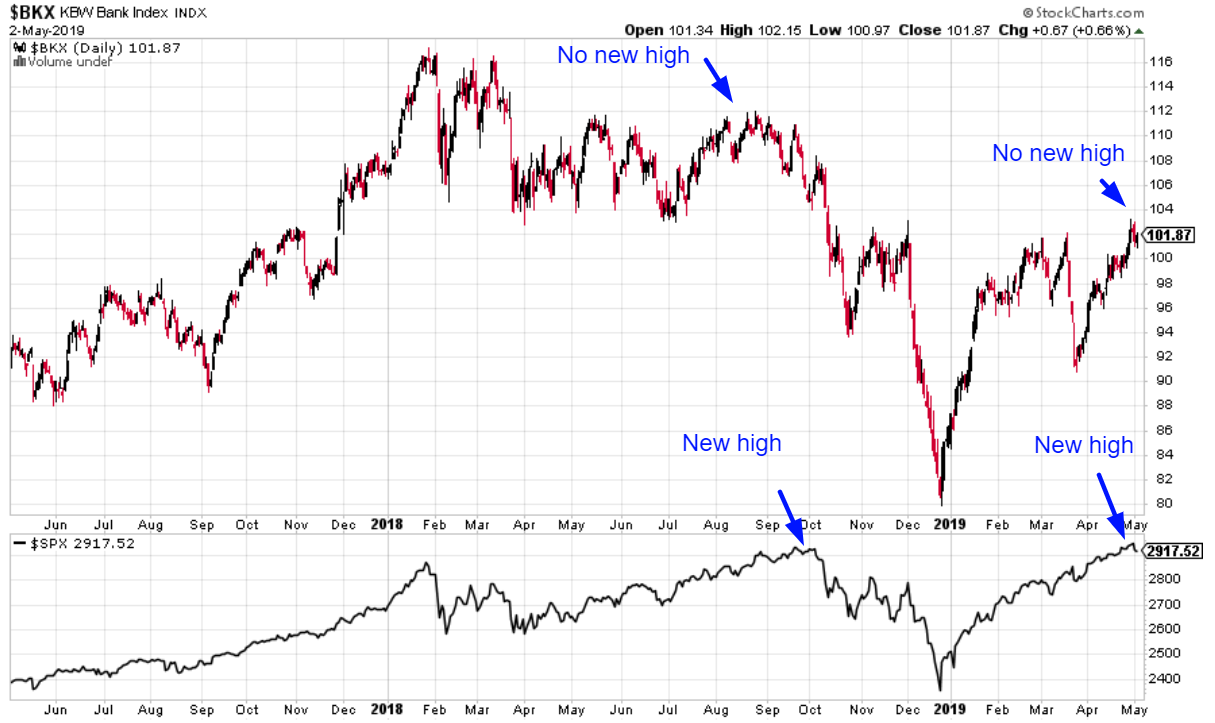
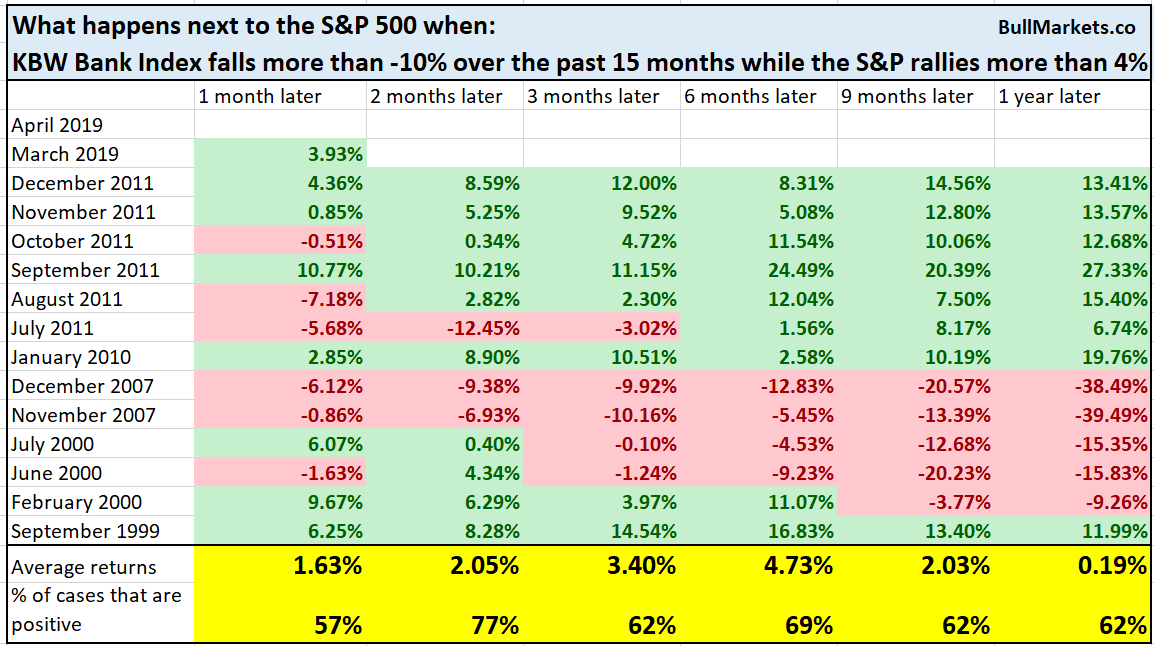
From 1994 – present, here’s every historical case in which the KBW Bank Index fell more than -10% over the past 15 months while the S&P rallies more than +4%.
So yes, this did happen before 2000 and 2007. But it also happened in other less ominous cases.
The S&P is the 20 DMA
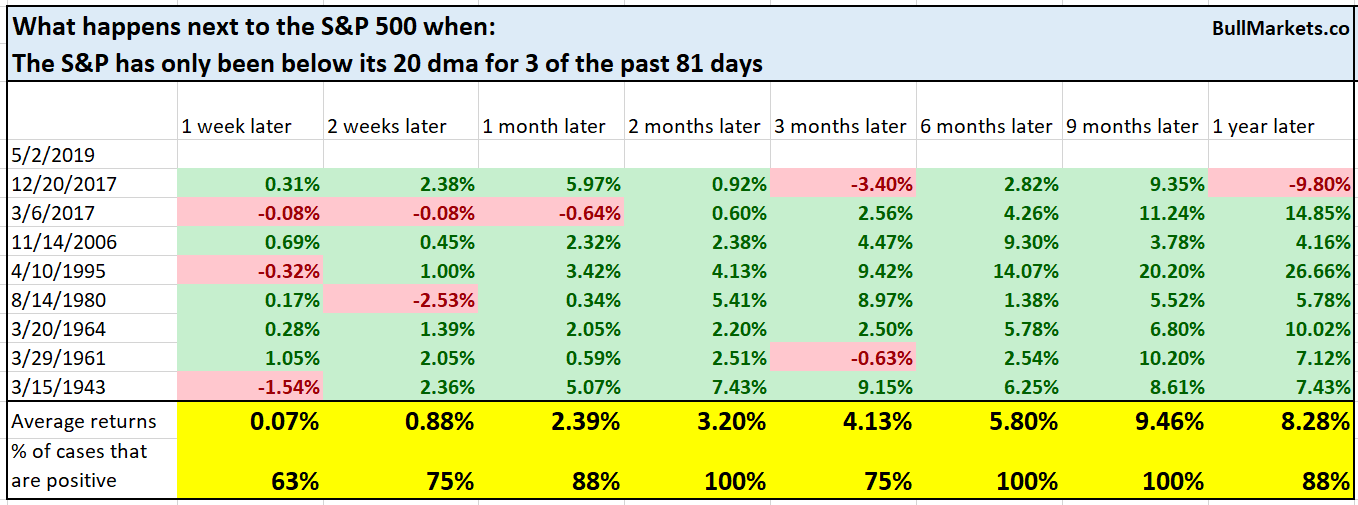
It’s hard to believe, but over the past 81 days, the S&P is been below its 20 DMA for only 3 days. Perhaps this streak will end soon.
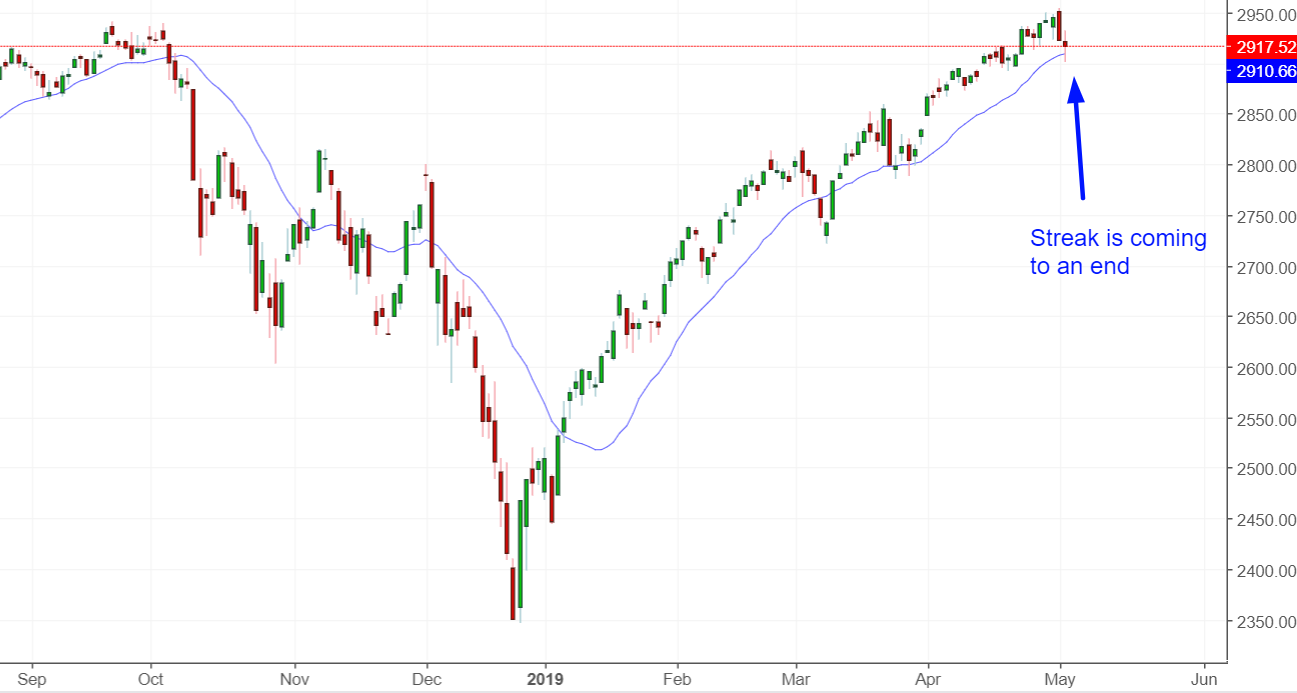
From 1923 – present, here’s what happens next to the S&P when it has only been below its 20 DMA for 3 or less of the past 81 days.
While the stock market has been trending higher over the past 2.5 months, the % of S&P stocks above their 50-day moving average has been trending lower. Surely this breadth divergence must be bearish for stocks?
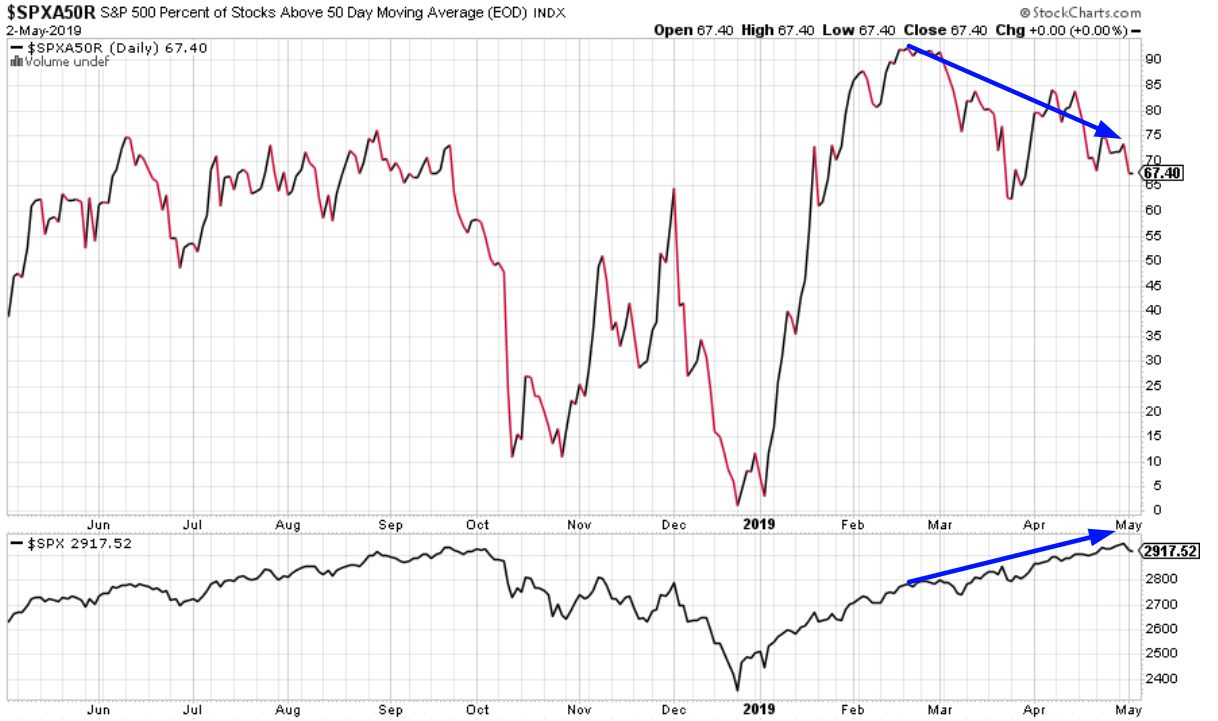
Here’s what happens next to the S&P when it rallies more than 4% over the past 50 days while the % of S&P stocks above their 50 DMA fell at least -25%.
*Data is limited from 2001 – present
The sample size is small, but it looks like the 2 week forward returns are mostly negative. What if we relax the study’s parameters?
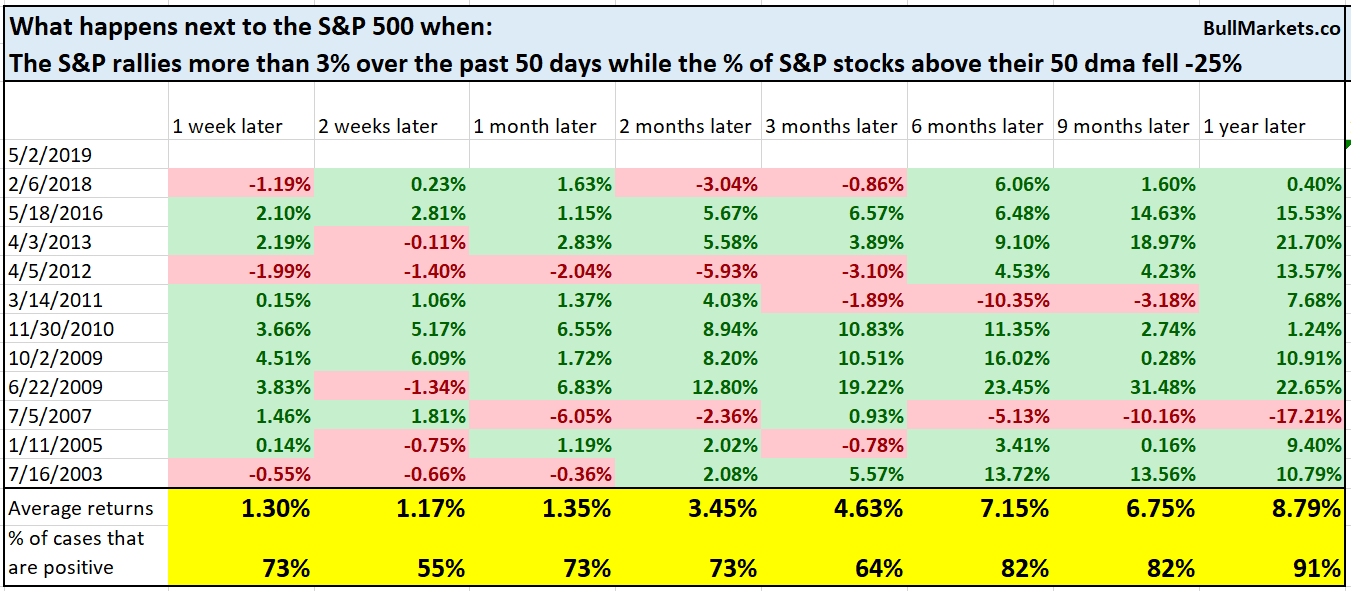
Here’s what happens next to the S&P when it rallies more than 3% over the past 50 days while the % of S&P stocks above their 50 DMA fell at least -25%.
You can see how the 2 week forward bearish returns mostly disappears, but the 6-12 month forward returns are largely the same.
VIX
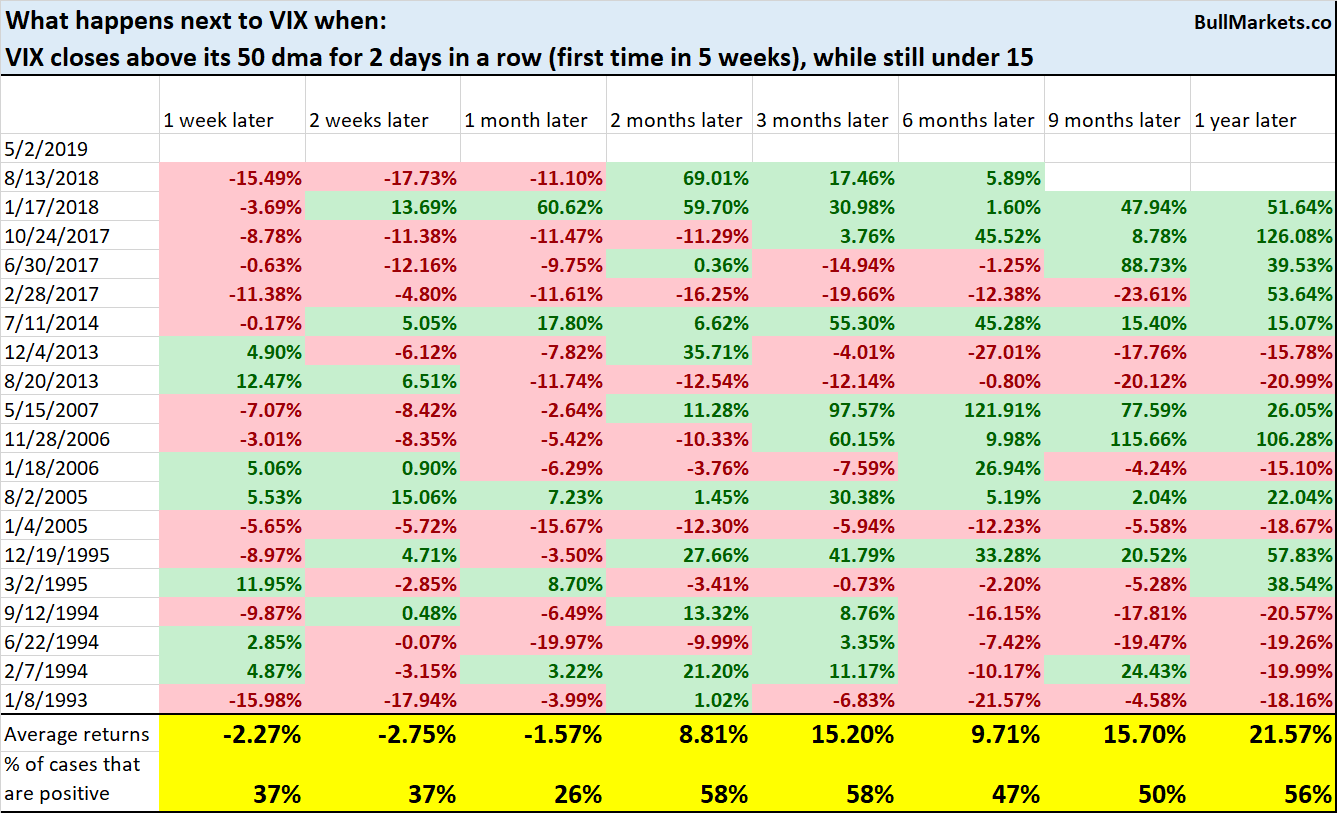
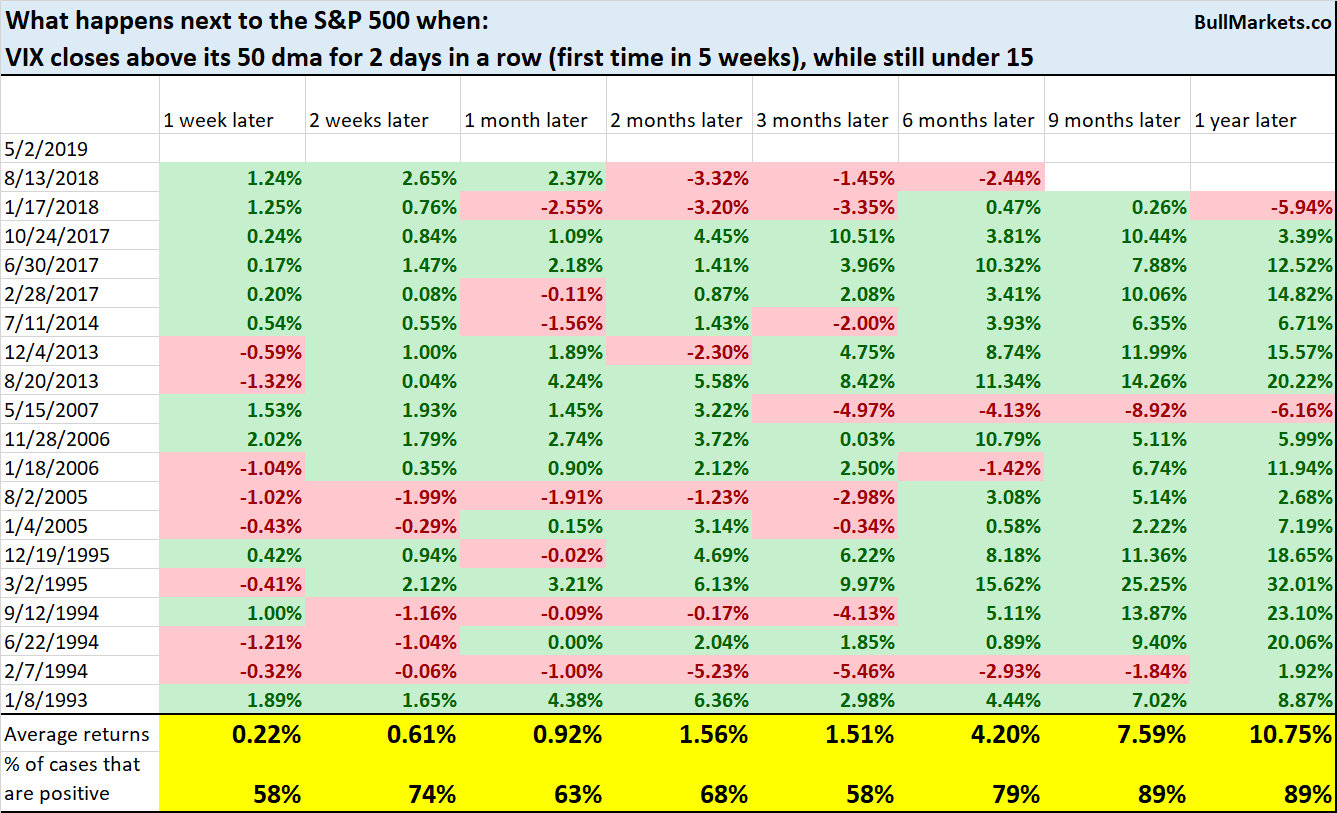
VIX has closed above its 50 DMA for 2 days in a row, for the first time in 5 weeks. It’s still under 15.
Is this the start of a sustained VIX spike?
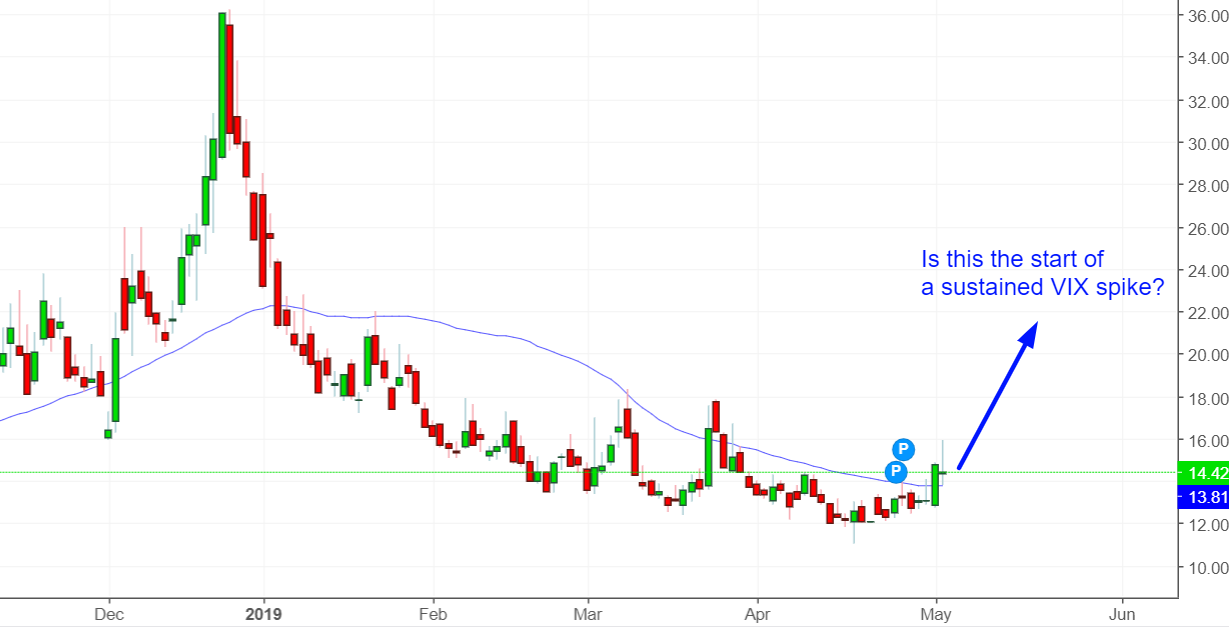
Similar historical cases say “no”.
Eventually, VIX will spike. But it’s incredibly hard to know if that “eventually” will be tomorrow, in a week, in a month, or 3 months.
Dr. Copper
Copper and oil (especially oil) have mostly moved in sync with the stock market recently. Both copper and oil peaked in mid-April, 2 weeks before the stock market peaked. Are commodities leading the stock market downwards?
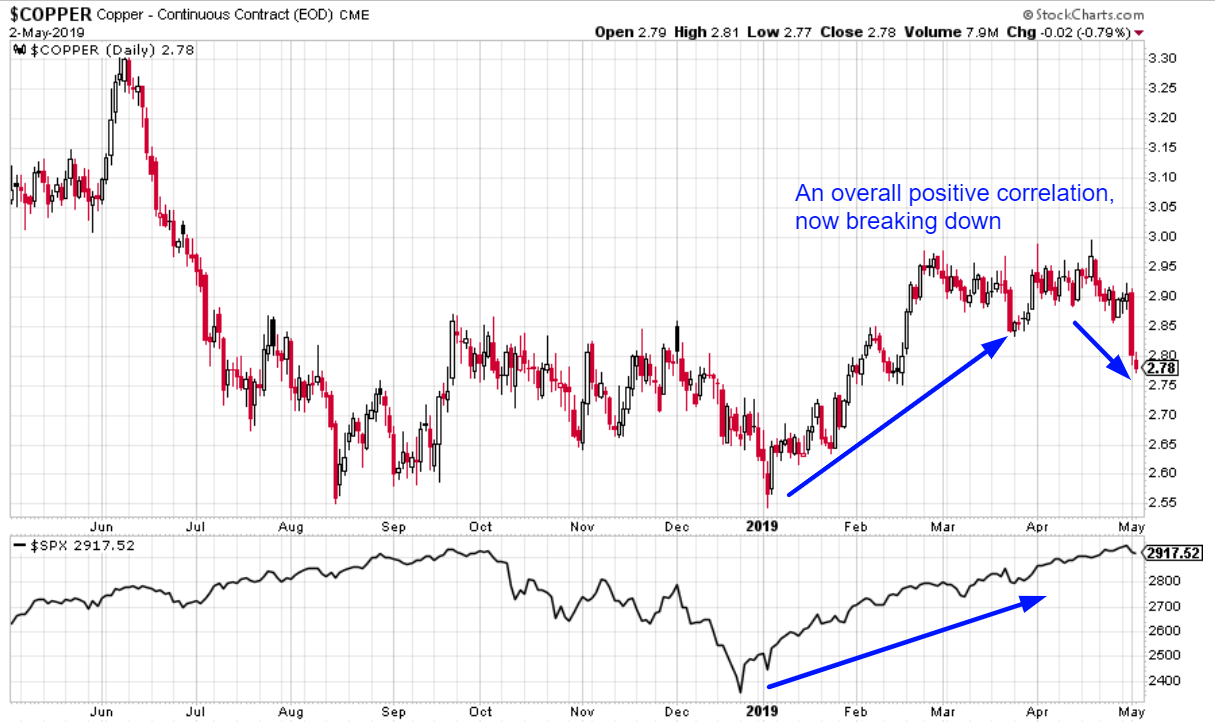
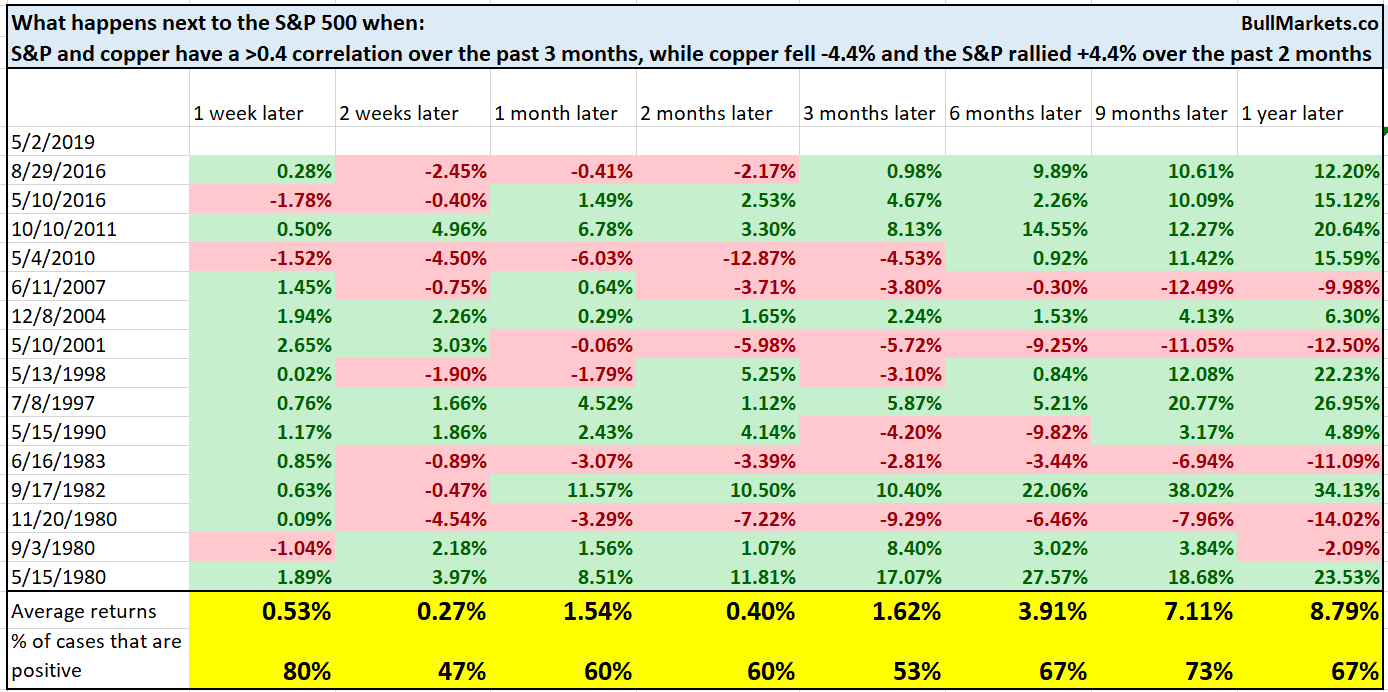
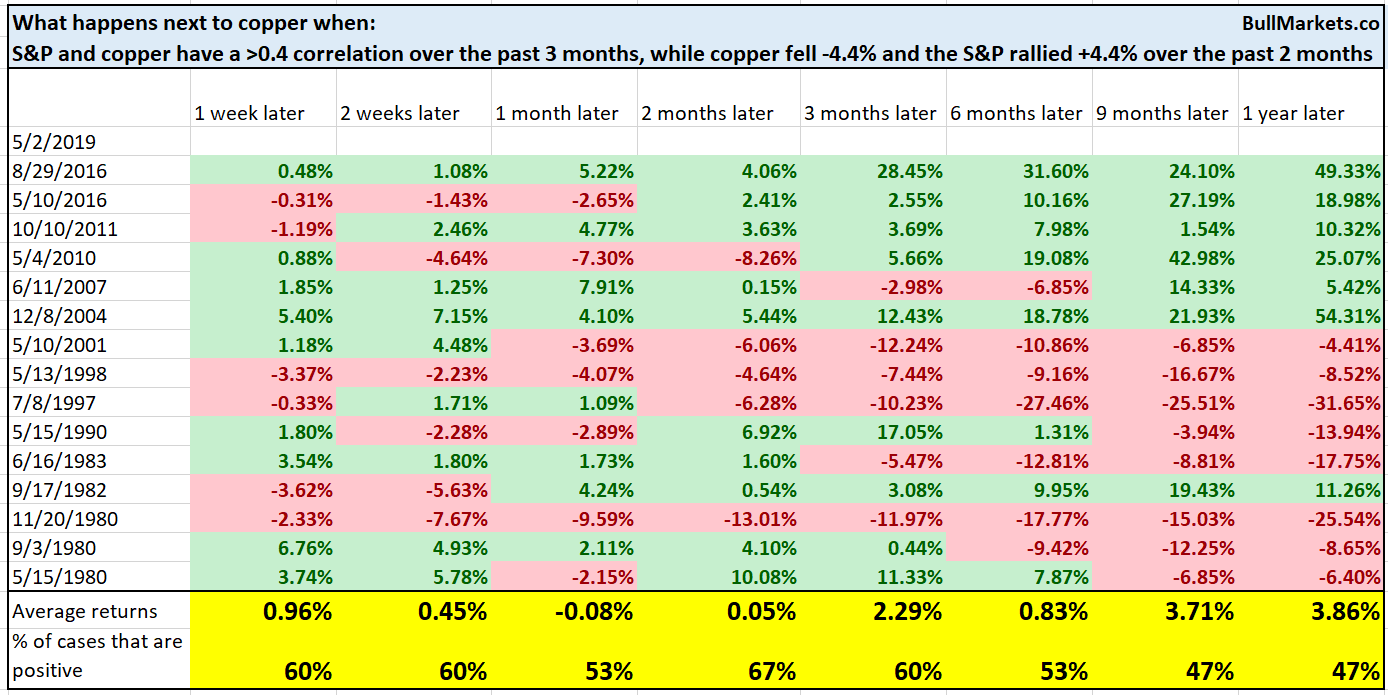
The S&P and copper have a 3-month correlation of 0.4 (moderately positive correlation). Meanwhile, copper has fallen -4.4% over the past 2 months while the S&P has rallied +4.4%. This demonstrates that copper is perhaps “leading the stock market down”.
Similar historical cases were mostly random for both the S&P and copper.
While many traders like to use inter-market analysis, I find that this doesn’t always work well for the U.S. stock market.
AAII
Sentiment mostly moves in line with the price.
- The price goes up = sentiment goes up
- The price goes down = sentiment goes down
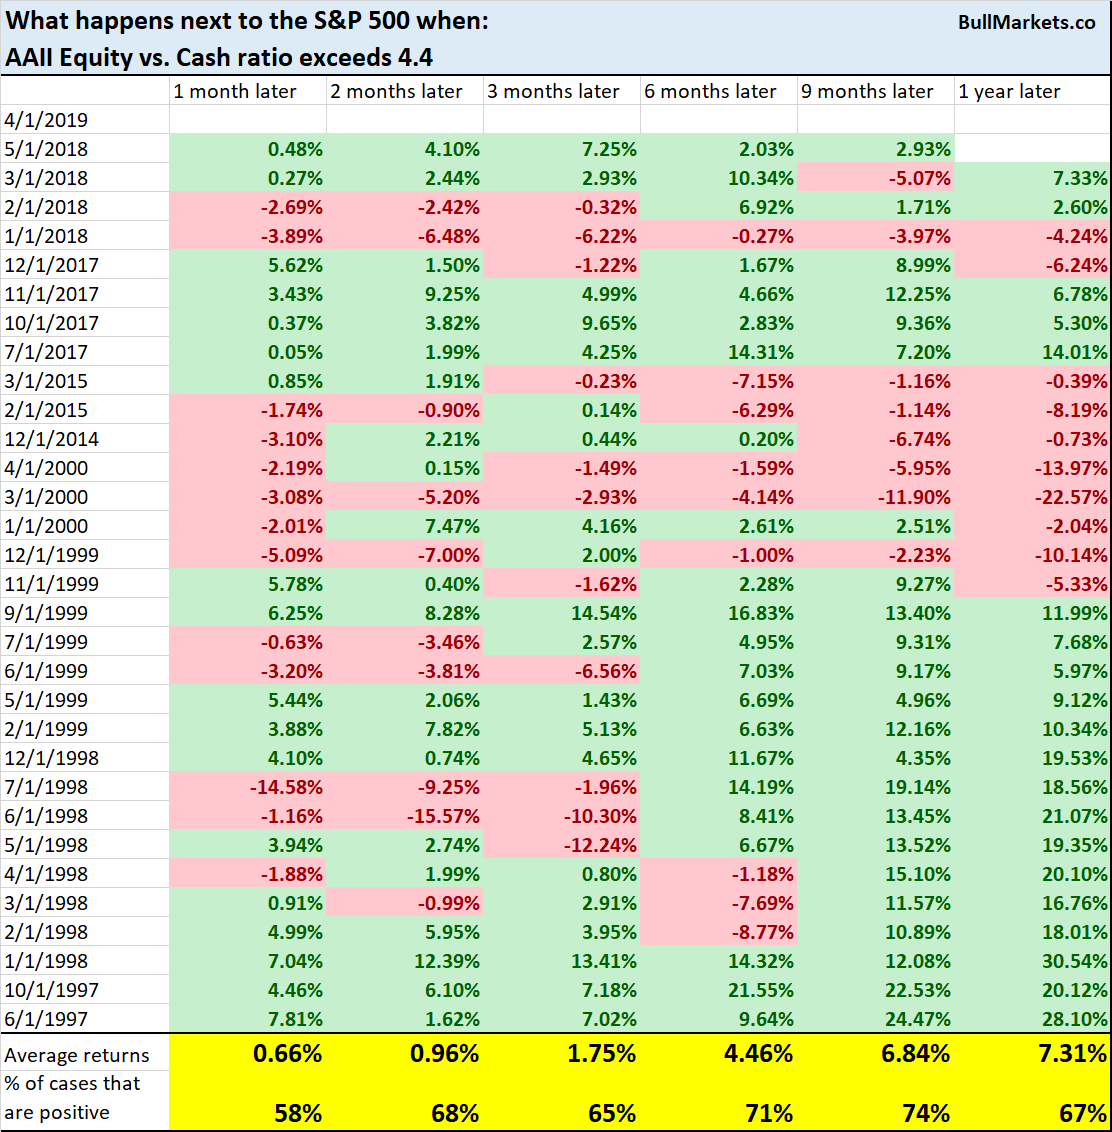
With the stock market rallying over the past 4 months, the AAII Equity vs. Cash Ratio is back up.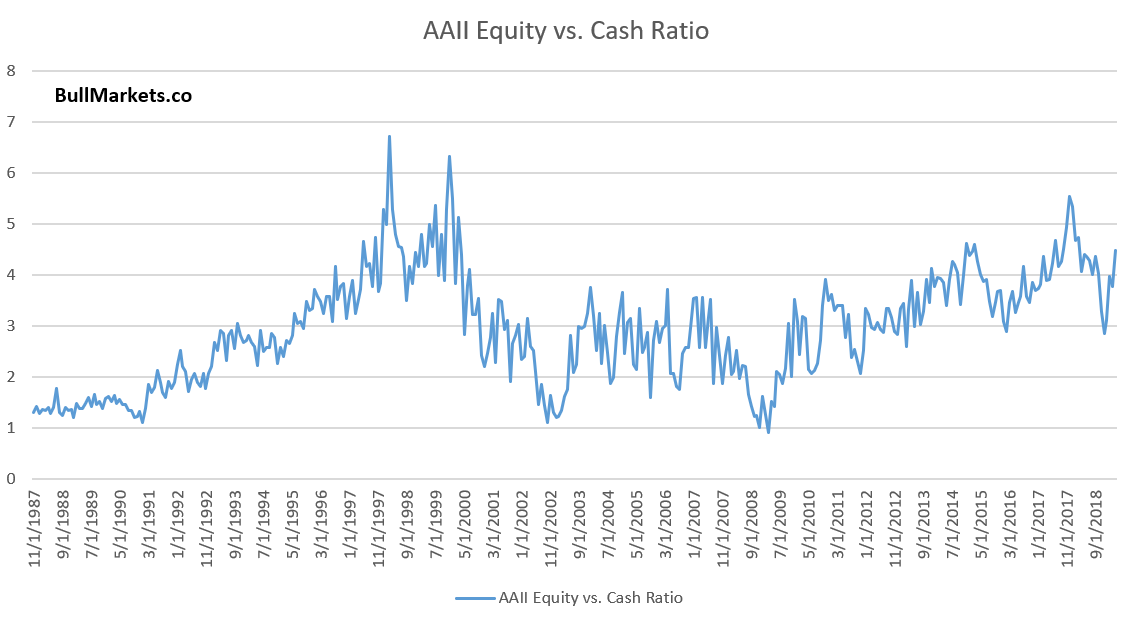
While this is a late-cycle sign, it doesn’t tell you when the bull market will end.
You can see that the AAII Equity vs. Cash ratio was this high from 1997-2000 and 2014-present. Late cycle. But then again, “late-cycle” can last for a while.
But is the recent surge in the AAII Equity vs. Cash ratio an example of a “blowoff top”?
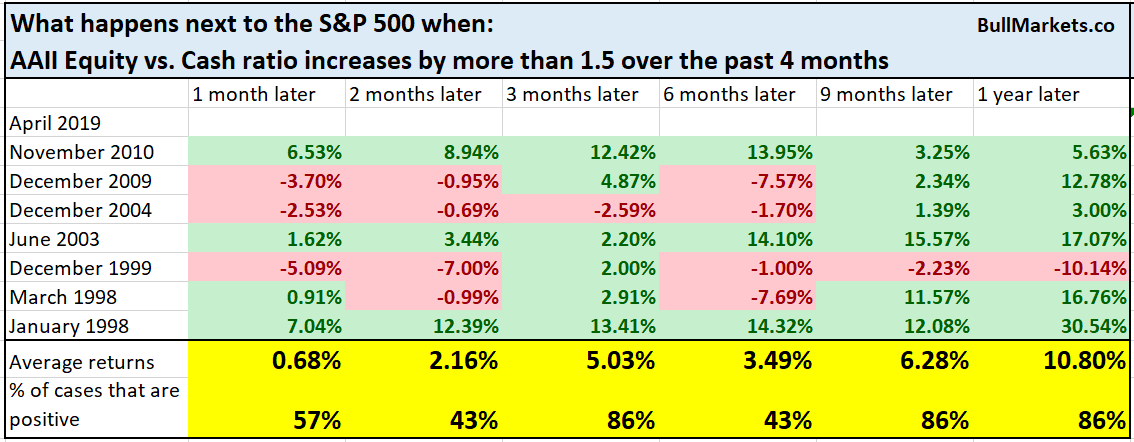
Here’s what happens next to the S&P when the AAII Equity vs. Cash ratio increases by more than 1.5 over the past 4 months.
No. Like I said, sentiment moves mostly inline with the price. It’s clear that a +20% rally in the past always caused the Equity vs. Cash ratio to spike.
XLE
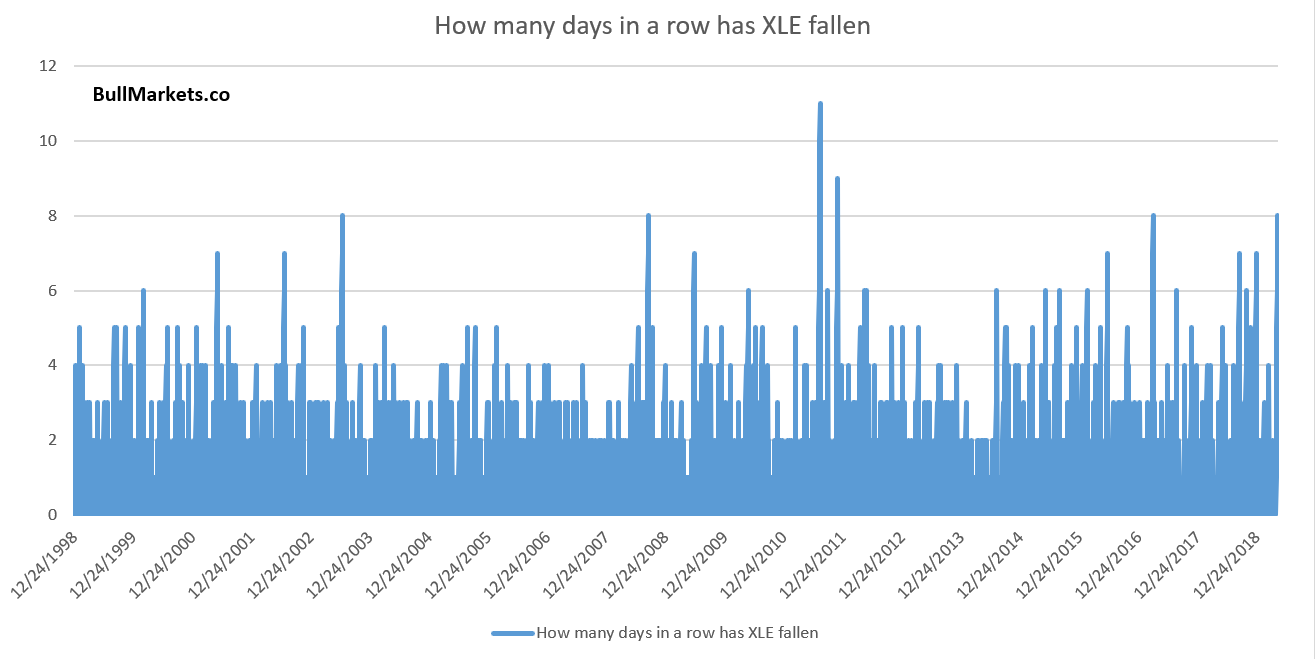
XLE (energy sector ETF) has fallen 8 days in a row.
This is rare and is neither consistently bullish nor bearish for XLE on any time frame.
Long losing streaks have been more common in recent years (2014-present). Perhaps it’s the algos – I don’t know. Extremes become more extreme in both ways (up and down).
*I generally don’t like to blame things on the algos. “The algos are at it again” is an excuse used by most traders when they don’t know what’s going on. It’s better to admit what you don’t know and just leave it at that.
Conclusion
Here is our discretionary market outlook:
- The U.S. stock market’s long term risk: reward is no longer bullish. In a most optimistic scenario, the bull market probably has 1 year left. Long term risk: reward is more important than trying to predict exact tops and bottoms.
- The medium-term direction (e.g. next 6-9 months) has a bullish lean.
- We don’t predict the short term because the short term is always extremely random, no matter how much conviction you think you have. Focus on the medium-long term.
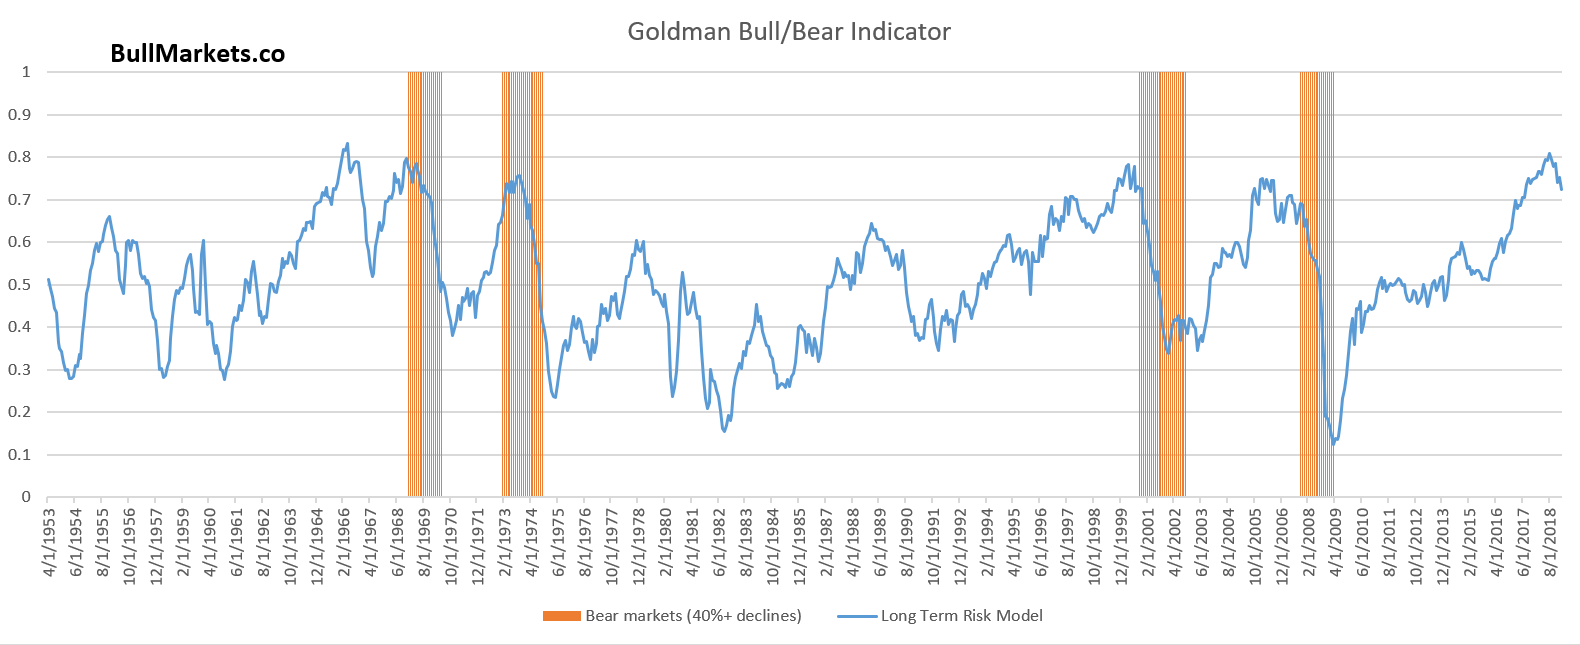
Goldman Sachs’ Bull/Bear Indicator demonstrates that risk: reward does favor long term bears.