When it comes to investing, if you stick around long enough you come to realize that success is not based on certainties or “sure things”, but rather on playing the odds (and reducing risk when the odds are against you).
The January Barometer was first popularized by Yale Hirsch of The Stock Trader’s Almanac and first mentioned in 1972. If posits that a price gain for the S&P 500 index during the month of January is bullish for stocks for the rest of the year, and vice versa.
Now like a lot of things related to the market if you Google (NASDAQ:GOOGL) “January Barometer” you get roughly 16.5 million related links. Let me save you some time. At one end of the spectrum are articles that say “Yes, you should pay attention to the January Barometer”. At the other end are articles that basically say, “this is the dumbest thing I’ve ever heard of”. And then of course there are the 16.49999 million articles that fall somewhere in between. So, who should you believe? How about “you”? I’ll show you some numbers and you decide for yourself. Fair enough?
The Post-Discovery History
Since Mr. Hirsch first mentioned it in 1972 we will start in 1973 and look at results in real-time. A few notes:
*For testing purposes, we are completely ignoring the month of January
*JB Bull Years encompass February through December S&P 500 Index price performance when the S&P 500 Index January shows a gain
*JB Bear Years encompass February through December S&P 500 Index price performance when the S&P 500 Index January shows a gain
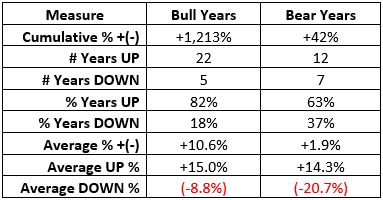
Figure 1 shows the relevant facts and figures

Figure 1 – JB Bull Years versus JB Bear Years; 1973-2018
A few things to note:
*The numbers demonstrate that the stock market “tends” to perform much better during JB “Bull Years” than during JB “Bear Years” – with a cumulative gain that is 29 time higher (+1,213% versus +42%), a higher percentage of UP years (82% vs. 63%), and a much lower Average DOWN years (-8.8% versus -20.7%).
*The bear market years of 1973, 1974, 2002 and 2008 were all presaged by a down January
*However, one key thing to note is this: A bullish January Barometer DOES NOT insulate you from risk, as was clearly demonstrated in 2018.
The Main Point
*A bullish or bearish January Barometer reading DOES NOT guarantee a bullish or bearish February through December going forward…..
*….BUT, if you are playing the odds you clearly want to give the bullish case the benefit of the doubt during JB Bull Years, and you need to pay particular attention to downtrends that begin to unfold during JB Bear Years.
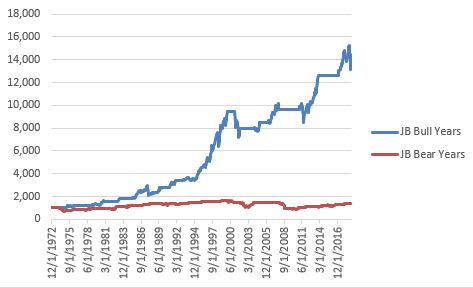
Figure 2 displays the growth of $1,000 invested in the S&P 500 Index (price performance only, not total return) Feb-Dec during JB Bull Years (blue) versus JB Bear Years.

Figure 2 – Growth of $1,000 invested in S&P 500 Index Feb-Dec during JB Bull Years (blue) versus JB Bear Years (red); 1973-2018
Figure 3 displays year-by-year results
| Year | January | Bull Year UP | Bull Year DOWN | Bear Year UP | Bear Year DOWN |
| 1973 | (1.7) | (15.9) | |||
| 1974 | (1.0) | (29.0) | |||
| 1975 | 12.3 | 17.2 | |||
| 1976 | 11.8 | 6.5 | |||
| 1977 | (5.1) | (6.8) | |||
| 1978 | (6.2) | 7.7 | |||
| 1979 | 4.0 | 8.0 | |||
| 1980 | 5.8 | 18.9 | |||
| 1981 | (4.6) | (5.4) | |||
| 1982 | (1.8) | 16.8 | |||
| 1983 | 3.3 | 13.5 | |||
| 1984 | (0.9) | 2.3 | |||
| 1985 | 7.4 | 17.6 | |||
| 1986 | 0.2 | 14.3 | |||
| 1987 | 13.2 | (9.9) | |||
| 1988 | 4.0 | 8.0 | |||
| 1989 | 7.1 | 18.8 | |||
| 1990 | (6.9) | 0.3 | |||
| 1991 | 4.2 | 21.3 | |||
| 1992 | (2.0) | 6.6 | |||
| 1993 | 0.7 | 6.3 | |||
| 1994 | 3.3 | (4.6) | |||
| 1995 | 2.4 | 30.9 | |||
| 1996 | 3.3 | 16.5 | |||
| 1997 | 6.1 | 23.4 | |||
| 1998 | 1.0 | 25.4 | |||
| 1999 | 4.1 | 14.8 | |||
| 2000 | (5.1) | (5.3) | |||
| 2001 | 3.5 | (16.0) | |||
| 2002 | (1.6) | (22.2) | |||
| 2003 | (2.7) | 29.9 | |||
| 2004 | 1.7 | 7.1 | |||
| 2005 | (2.5) | 5.7 | |||
| 2006 | 2.5 | 10.8 | |||
| 2007 | 1.4 | 2.1 | |||
| 2008 | (6.1) | (34.5) | |||
| 2009 | (8.6) | 35.0 | |||
| 2010 | (3.7) | 17.1 | |||
| 2011 | 2.3 | (2.2) | |||
| 2012 | 4.4 | 8.7 | |||
| 2013 | 5.0 | 23.4 | |||
| 2014 | (3.6) | 15.5 | |||
| 2015 | (3.1) | 2.5 | |||
| 2016 | (5.1) | 15.4 | |||
| 2017 | 1.8 | 17.3 | |||
| 2018 | 5.6 | (11.2) |
Figure 3 – Year-by-Year Results for January Barometer using S&P 500 Index price performance; 1973-2018
Summary
If you are expecting the January Barometer to act as a flawless timing system, then you will be disappointed. If you are looking for something to help you stay on the right side of the market the majority of the time, then the January Barometer is a useful tool (in my opinion).
Yale Hirsch made the January Barometer public knowledge in 1972. Based on results since that time, it looks like he was on to something.
