Someone emailed me this article published at Yahoo!Finance that purports the Fed’s tightening is going to send stocks soaring, the Dow Jones Industrial Average mentioned specifically heading toward 25,000. The way in which this thesis was derived is the object of inquiry, starting with the belief that QE4 (QE5 by my reckoning) is forthcoming. This is not due to the Fed realizing its grave economic mistake but because the bond market is supposedly close to implosion.
Thus, more QE will be needed to save the treasury market and indirectly send stocks on a 2013-like odyssey. The foundation for this speculation, however, is what calls for clarification:
In order for this to occur, the Fed would need to reverse its current tightening stance and expand its balance sheet again with more quantitative easing. This would require a tremendous shock because the Fed does not want to lose credibility by reversing monetary policy too soon.
Lamoureux believes this shock will come from a U.S. government bond market implosion, which in turn will stem from the Fed’s second mistake—draining money from the economy too quickly.
Since September 2014, the amount of money that banks park at the Fed, called excess reserves, has dropped by $370 billion.
Lamoureux believes this money has temporarily plugged a hole in the bond market, which is teetering on the precipice of collapse.
So what Mr. Lamoureux claims is that the balance of reserves at the Fed is both “tightening” and “draining” but at the same time being used in the treasury market to “plug a hole” if only temporarily. As with most things about central banks, the math is right but little else is.
It is entirely true that reserves, excess or not no longer matters in any meaningful sense, have declined by about $350 billion since September 2014. The Fed’s H.4.1 statement for September 17, 2014, (the article doesn’t specify which week, so I picked one in the middle) shows total reserves of $2.797 trillion against the January 21, 2016, H.4.1 that declares only $2.455 trillion – a difference of -$343 billion. Is that the Fed tightening? Not remotely.
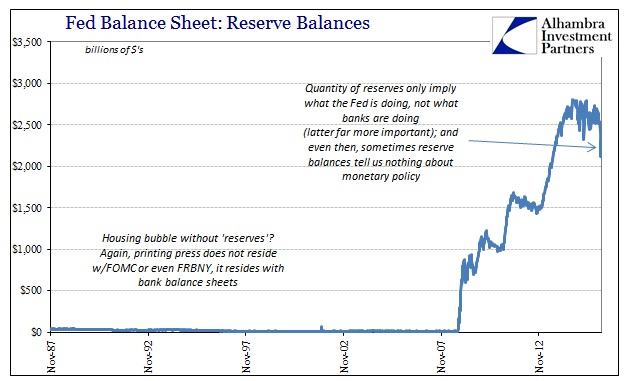
Central bank accounting starts on the asset side and doesn’t necessarily include what would be liabilities in a private setting. Monetary policy resides specifically on that asset side. Any expansion or contraction of assets gives rise to differing functions; what are called (in Europe this is specified) autonomous factors and the leftover “liquidity” as bank reserves. In QE, the Fed “purchased” UST’s and MBS to expand the asset side, and the balancing side in autonomous factors was largely left unaffected so that the balance sheet increase overall flowed almost exclusively to bank “reserves.”
In terms of QE’s end, we see that there is actually very little difference on the asset side between September 2014 and January 2016; in fact, contra Mr. Lamoureux, the Fed’s balance sheet is slightly larger now than sixteen months ago. That leaves the difference in bank reserves to autonomous factors alone:
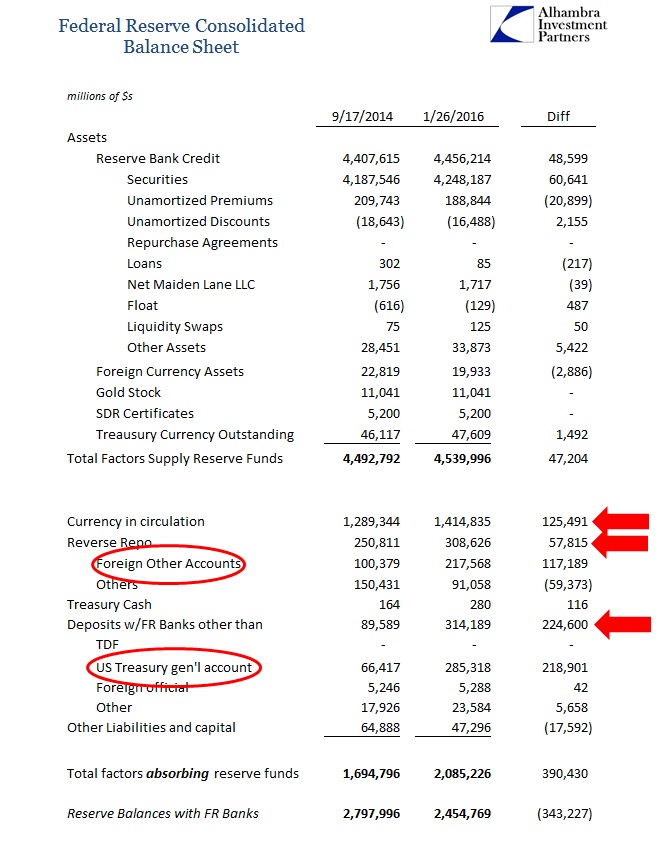
In fact, the disparity can be explained in three line items alone: currency (physical notes and coins), foreign accommodations in RRP, and the balance in the US Treasury’s general account. That last autonomous change I last dealt with on the Chinese side which appeared to have the practical effect of giving the PBOC a single month reprieve from further disaster in internal yuan liquidity – again, not as a matter of monetary policy but only the peculiar construction of central bank balance sheets that are agents of the governments they are tied to (thus, autonomous). In this case, the US Treasury has a higher balance at the Fed which has the effect of appearing to be a drain on reserves but really is nothing more than an accounting maneuver (unlike China).
That leaves us with the theory of a bond market implosion predicated upon stablemonetary policy with morephysical cash in circulation; I don’t think that is what he had in mind. The only factor that might suggest the hint of irregularity is the sudden rise in the foreign RRP, but that isn’t so much a US Treasury market problem as foreign/offshore “dollar” issue(subscription required).
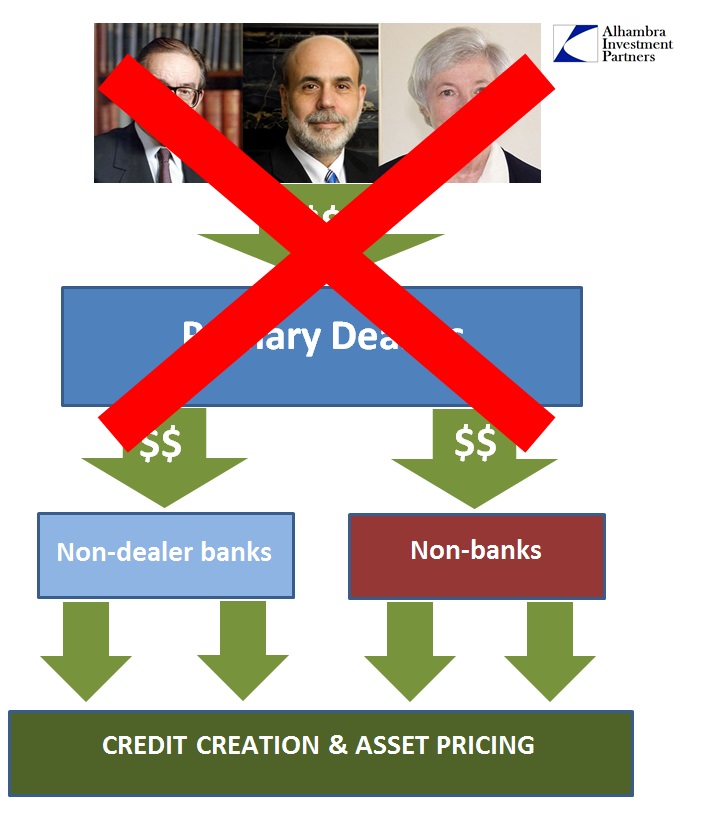
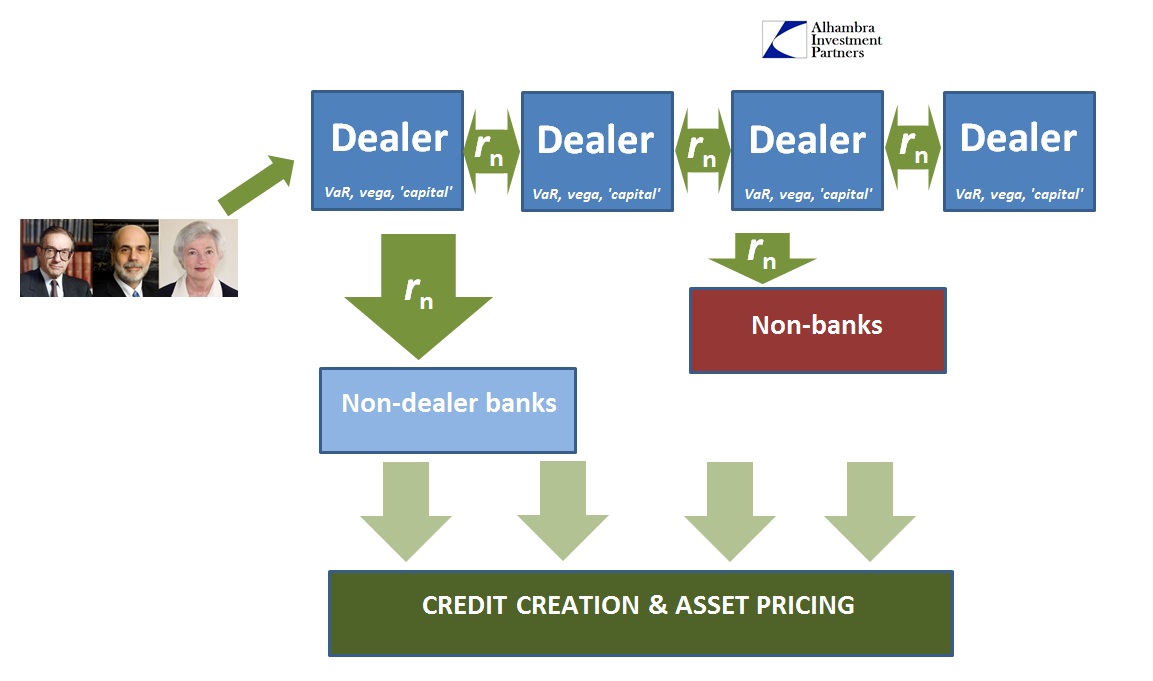
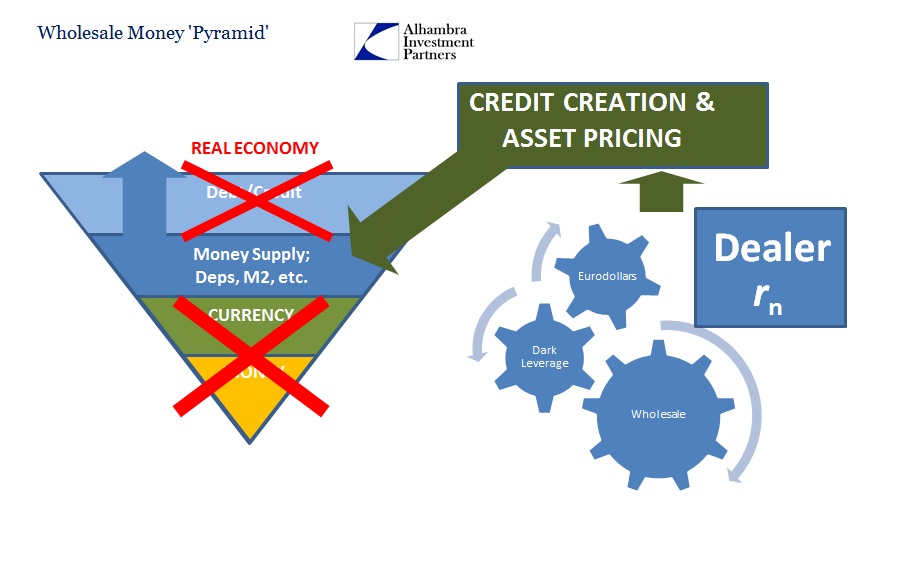
This is furthering the idea I wrote about this morning, via “missing money.” All this accounting and arcane searching amidst the Federal Reserve’s balance sheet matters so very little. The Fed is supposedly tightening, but the larger “dollar” markets have been doing that since before all this was an issue. In fact, it produces a great deal of absurdity in thinking that Federal Reserve asset byproducts are actually usable currency in the larger “dollar” system. The FOMC voted in mid-December to raise rates, to “tighten” monetary policy, and the already “tightened” “dollar” system responded by further reducinginterest rates across the board – eurodollars to UST curves. So the real tightening was in lower market-determined interest rates while policy-demanded higher interest rates, where they actually occurred, were RHINO(subscription required).
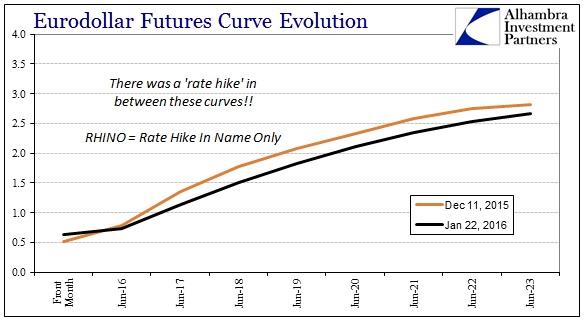
Again, missing money. The Fed is simply not the center of the financial universe, though its agents like to claim the reputation. I think, however, this was the effect of QE through what really amounts to balance sheet confusion. It certainly appears as if the Fed has been “printing money” but instead all they got were crashing inflation expectations and a pretty consistent inability to meet their most basic monetary objective for going on close to four years. The FOMC has been afforded far more power than it ever deserved(s); a point that 2008 should have reinforced with unassailable implications. Its relative impotence applies in both directions.
They “bought” $3.5 trillion in securities and still the “missing money” wins. We may not be able to quantify the eurodollar’s decay and implosion, but this comparison gives us a rough idea about the magnitude.

