For the last several years, Robo-advisors have been touted as the “holy grail” of investing. Unfortunately, the first major review of reveals they all failed their first big test of benchmark performance.
Before I get into the study, we need to review the “active vs. passive” debate that has been raging over the last several years. I previously discussed an article on this issue from Larry Swedroe. To wit:
“Over 15-years, on an equal-weighted (asset-weighted) basis, the average actively managed U.S. equity fund underperformed by 1.4% (0.74%)per annum. The worst performances were small caps, with active small-cap growth managers underperforming on an equal-weighted (asset-weighted) basis by 1.99% (0.90%) per annum, active small-cap core managers underperforming by 2.43% (1.82%) per annum, and active small–value managers underperforming by 2.00% (1.71%) per annum. So much for the idea that the small-cap asset class is inefficient and active management is the winning strategy.”
But here is the key conclusion from Larry’s post:
“S&P’s SPIVA scorecard provides persuasive evidence of the futility of active management.”
The premise is that “passive investing” is the only way to generate benchmark performance.
If it were only that simple.
The Study
A recent post on Advisor Perspective discussed the issue:
“Robo-advisors faced their first big challenge with the bear market in the first quarter of 2020. They lost, and that is an ominous sign for the future of automated advice.
All robos employ a degree of active management. They deviate from the cap-weighted market portfolio through fund selection or sector allocation. As active managers, robo-performance can be fairly viewed only through a full market cycle. Nobody needs an active manager in a bull market; index returns are adequate. Active management shows its value in its ability to protect against adverse market conditions. The market downturn in the first quarter gave us that opportunity.” – Robert Huebscher, Advisor Perspectives
Backend Benchmarking (BEB), did the actual analysis on the performance of Robo-advisor results. BEB tracks the performance of 60 robo portfolios, although it does not have the full history for all of them. It compares each portfolio to a benchmark consisting of a 60/40 equity/fixed income ETF portfolio. It deducts 30 basis points annually from the benchmark to normalize for the expenses charged by the advisor platforms.
Here is a summary of their respective performance relative to the benchmark:
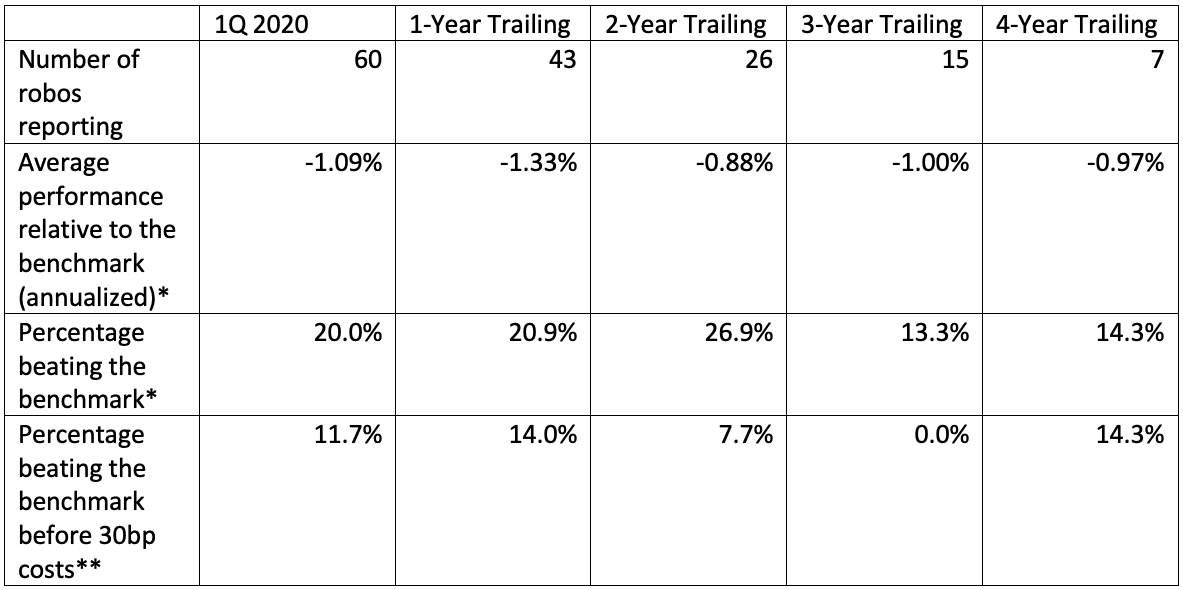
While Robo-advisor platforms were initially touted as the solution to “get the performance you deserve” in your portfolio, they fell short of their goals. As noted by Robert:
“A key takeaway from this table is that robos underperformed their benchmarks in every period available, including Q1 of 2020. The average underperformance was approximately 1% for each of those periods.
Given that four-year performance data is available for only seven robos, it is premature to write their obituary. But the fact that so few robos outperformed a passive benchmark over all the periods measured by BEB is a stern warning to investors. This data measures the aggregate performance across all robos. It is possible that, over time, a robo may emerge from the 60 studied by BEB that exhibits the skillfulness to outperform passive benchmarks. But, given the large-scale failures documented in this table, that possibility is unlikely.”
Even Index Funds Can’t Beat The Index
The results of the study, however, should not be a surprise. As I noted in my previous discussion, even index funds don’t beat their benchmark index over time.
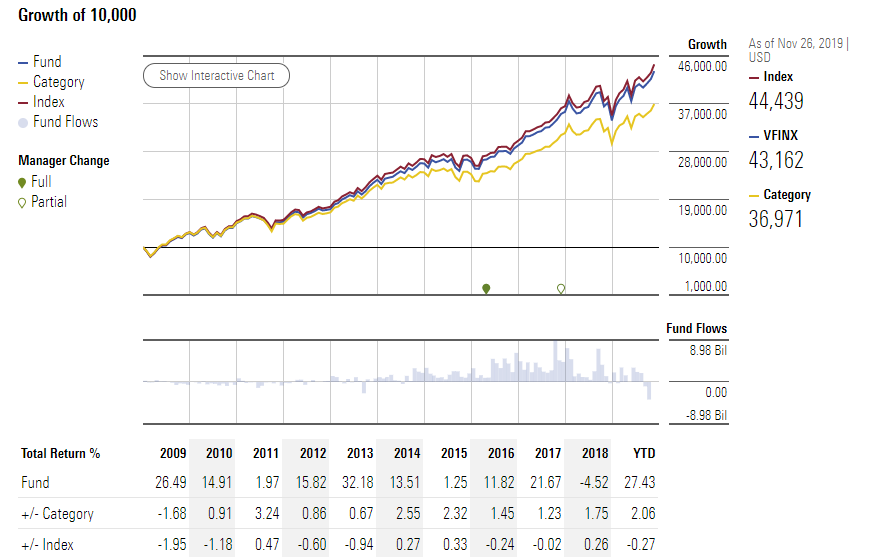
How is it that a fund that is supposed to replicate an index purely failed to match the performance of the index exactly?
Simple.
Fees, taxes, and expenses.
The same applies for Robo-advisors and anyone else who manages money either actively or passively.
Unfortunately, in the “real world” where people invest their “hard-earned savings,” overall returns are constantly under siege from taxes, previously commissions, fees, and, most importantly – taxes.
An “index,” which is simply a mathematical calculation of priced securities, has no such detriments.
The chart below is the S&P 500 Total Return Index before and after the same expense ratio charged by the Vanguard S&P 500 Index Fund. Since most advisers don’t manage client money for free, I have also included an “adviser fee” of 0.5% annually.
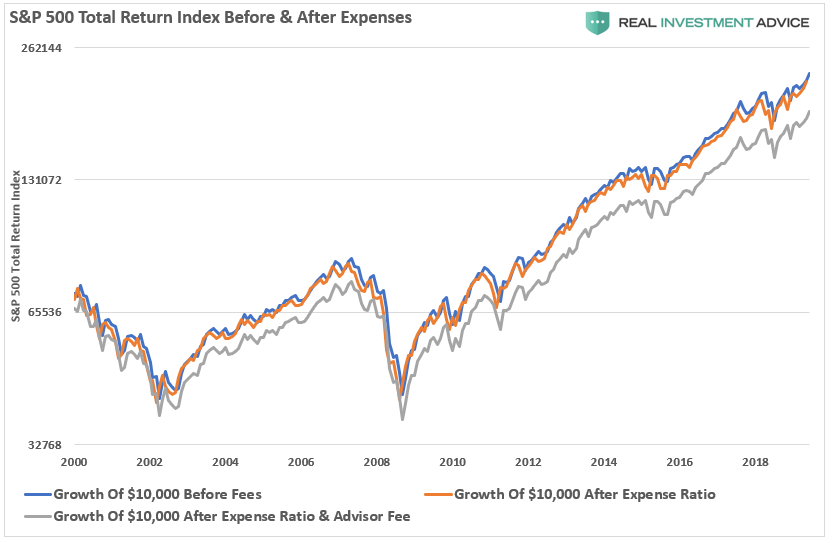
Of course, if you are just trying to match an index, then you lose the opportunity to outperform the index though asset, sector or market selection.
Comparison Envy
There are many problems with benchmarking, but the biggest is “comparison envy.” As I wrote previously on this issue:
“Comparison in the financial arena is the main reason clients have trouble patiently sitting on their hands, letting whatever process they are comfortable with work for them. They get waylaid by some comparison along the way and lose their focus. If you tell a client that they made 12% on their account, they are very pleased. If you subsequently inform them that ‘everyone else’ made 14%, you have made them upset.
The construction of the financial services industry is to make people upset so that they will move their money around in a frenzy. Money in motion creates fees and commissions. The creation of more and more benchmarks and style boxes is nothing more than the creation of more things to COMPARE to, allowing clients to stay in a perpetual state of outrage.”
Such could not be more to the point than anything that we have discussed today. Comparing your performance to an index is the most useless, and potentially dangerous thing that you can do as an investor.
Trying to “beat an index” requires investors to take on substantially more risk than they realize. However, higher levels of risk are necessary to try and make up the difference once you fall behind. Such leads, ultimately, to more significant mistakes that cost investors dearly.
Benchmarks Aren’t Real
Wall Street created benchmarks to give you something to chase. Like a greyhound at the race track chasing the mechanical rabbit. The dog will never catch it, but he tries every time the gates open.
The need to compare is a psychological need and part of the human condition. The “need to win” leads us into making decisions that ultimately have a cost.
However, the thing we are trying to “beat” is an “illusion.” Like a “Unicorn,” indexes are an illusion of mathematical calculations which are devoid of the many aspects of a real portfolio.
1) The index contains no cash
2) It has no life expectancy requirements – but you do.
3) It does not have to compensate for distributions to meet living requirements – but you do.
4) It requires you to take on excess risk (potential for loss) to obtain equivalent performance – this is fine on the way up, but not on the way down.
5) It has no taxes, costs or other expenses associated with it – but you do.
6) It can substitute at no penalty – but you don’t.
7) It benefits from share buybacks – but you don’t.
To win the long-term investing game, your must build your portfolio around the things that matter most to you.
– Capital preservation
– A rate of return sufficient to keep pace with the rate of inflation.
– Expectations based on realistic objectives. (The market does not compound at 8%, 6% or 4%)
– Higher rates of return require an exponential increase in the underlying risk profile. Such tends not to work out well.
– You can replace lost capital – but you can’t replace lost time. Time is a precious commodity that you cannot afford to waste.
– Portfolios are time-frame specific. If you have a 5-years to retirement but build a portfolio with a 20-year time horizon (taking on more risk,) the results will likely be disastrous.
We Are Supposed To Be Long-Term Investors
In any given short-term period, a manager of an active portfolio may make bets which either outperform or underperform their relative benchmark. However, we are supposed to be long-term investors, which suggests that we should focus on the long-term results, and not short-term deviations.
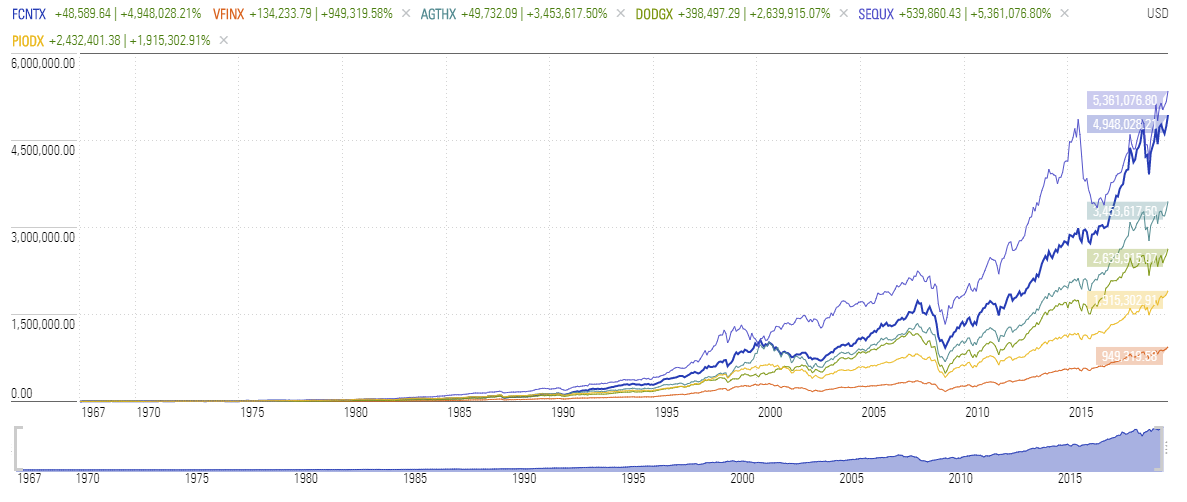
The following chart of the Fidelity Contra Fund versus the Vanguard S&P 500 Index proves this point. Which fund would you have rather owned?
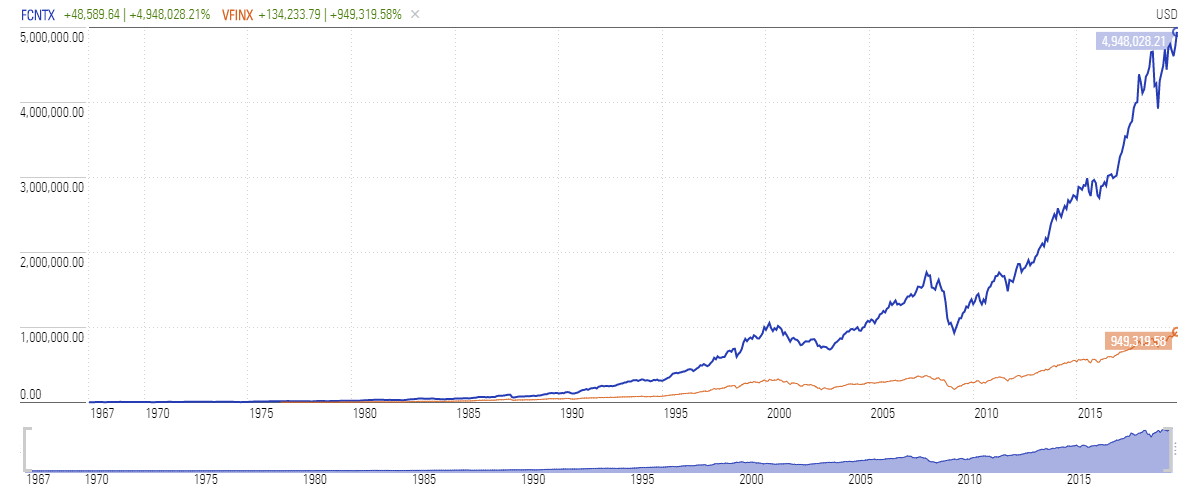
Finding funds with very long-term track records is difficult because the majority of mutual funds didn’t launch until the late “go-go 90’s” and early 2000’s. However, I did a quick lookup and added 4-more active mutual funds with long-term track records for comparison. The chart below compares Fidelity Contrafund, Pioneer Fund, Sequoia Fund, Dodge & Cox Stock Fund, and Growth Fund of America to the Vanguard S&P 500 Index.
Be Careful Which You Choose
I don’t know about you, but an investment into any of the actively managed funds over the long-term horizon certainly seems to have been a better bet.
As I said, the index is a mythical creature, and chasing it takes your focus off of what is most important – your money and your specific goals. Investing is not a competition, some years you will win, and some you will lose, but a long-term investment discipline will always win over time.
As the study on Robo-advisors proves, there is no “holy grail” of investing. Investing is not easy and requires a consistent and disciplined approach to win the “long-term” game. Conversely, chasing performance has a long history of horrid outcomes.
Be careful which you choose.
