The seasoned Gold enthusiast is sensitive to seasonality. And by conventional wisdom, 'tis said that the run from September through November is Gold-positive. After all: Gold is thought to sop up the negativity suffered by stocks in September, mitigate the surprises of October, and benefit by holiday spending into November. 'Tis Gold's season to be jolly. Or better stated, 'twas Gold's season to be jolly, that to expect same today may well be folly.
"You're not going to upset that apple cart, are you mmb?"
Now just bear up, Squire: you shan't get this anywhere else, so pay attention. 'Tis our wont to upgrade your wisdom from conventional to informed. To be sure, in this business nobody knows with certainty what is going to happen, however we attempt to stay above water in being guided by experience from that which has been happening, toward assessing one's expectations and in turn managing one's risk moving forward.
So from the "What's Been Happening Dept.", here we go with that from the past which we know.
Clearly one of the most heavily traded periods of the year across the spectrum of the BEGOS Markets (Bond / Euro / Gold / Oil/ S&P) is from the day after StateSide Labor Day (first Monday in September) through the day before StateSide Thanksgiving (last Thursday in November). Indeed for the first full 19 years of this century, more stock market futures contract volume has traded in the September-November period than in any other discreet three-month period, (i.e. Dec-Feb, Mar-May and Jun-Aug). Thus this Monday being Labor Day, come Tuesday for some 11 weeks right up to Thanksgiving 'tis "GAME ON!"
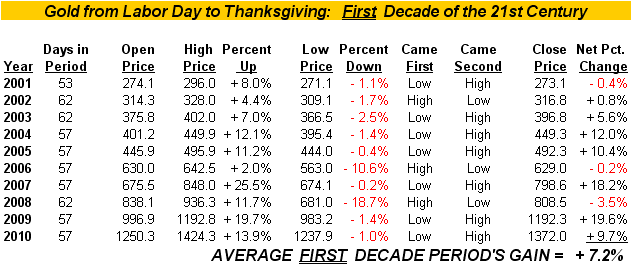
And by conventional wisdom along with its aforementioned seasonality rationale, there's thought to be within overall market chaos the shining safe haven of Gold. One only has to look at the following table of this century's first decade of Gold's performance from Labor Day to Thanksgiving, i.e. each year from 2001 through 2010: seven of those ten years posted net increases for that period for an average gain of +7.2%, the losing years in tow being comparatively mild, and the high price generally coming after the low price. Jolly indeed:
"But since then, mmb?"
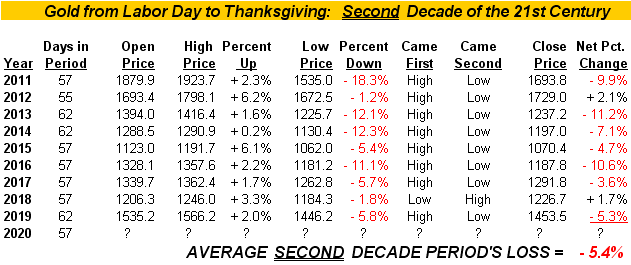
The truth can hurt, Squire, but we put it out there such that it can be anticipated and negotiated. Here is the like table during this century's second decade (nine full years thus far for those of you who know how to properly count) of Gold's performance from Labor Day to Thanksgiving, i.e. each year from 2011 through 2019, with 2020 now in the balance. And but for two meager up years, the other seven posted net decreases for that period for an average loss of -5.4%, the low price dominantly coming after the high price. Folly indeed:
Do we thus conclude that Gold's once-heralded positive seasonality for this time of year is a thing of the past? Not comprehensively, of course. Still, with specific respect to such seasonality kicking in this time 'round -- and given as written "nobody knows with certainty what is going to happen" -- bear in mind that the trend is one's friend. Or as Will Rogers perfectly put it: "Only buy the stocks that go up; if they don't go up, don't buy 'em."
And as for such present trend, we reiterate what was presented last week, both cases still in force that:
■ Gold's 21-day linear regression trend has rotated to negative, and
■ Gold's weekly parabolic trend has flipped to Short.
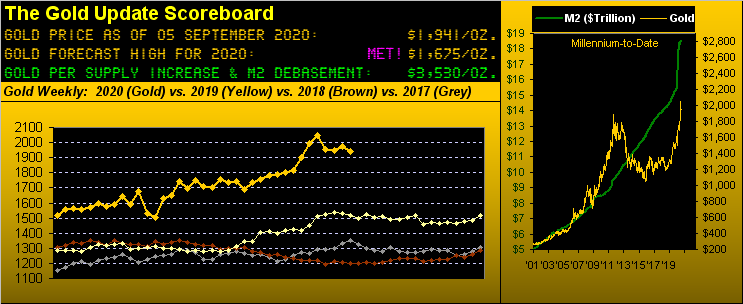
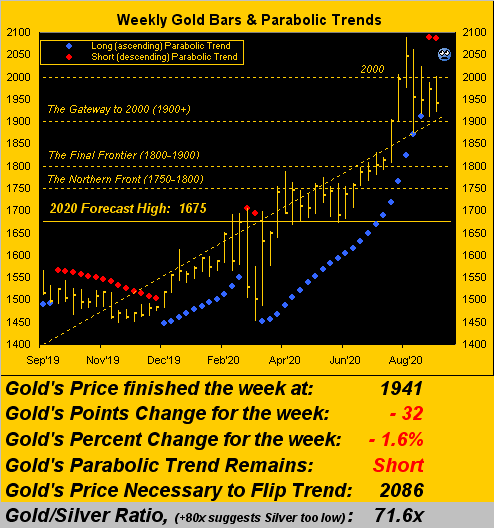
Those two albeit solely technical trends do not bode well at least near-term for Gold, the suggestion being that 'twill be yet another negative Labor Day to Thanksgiving run as has overwhlemingly been the case this decade-to-date. Fortunately however, the ongoing massive mitigant to such negativity is the fundamental fact of Gold's remaining significantly undervalued vis-à-vis currency debasement, our opening Gold Scoreboard pegging price at the "ought be" level of 3530, some 82% above where it actually settled out the week yesterday (Friday) at 1941. But as we turn to the chart of Gold's weekly bars, we nonetheless see the second red dot of parabolic Short trend:
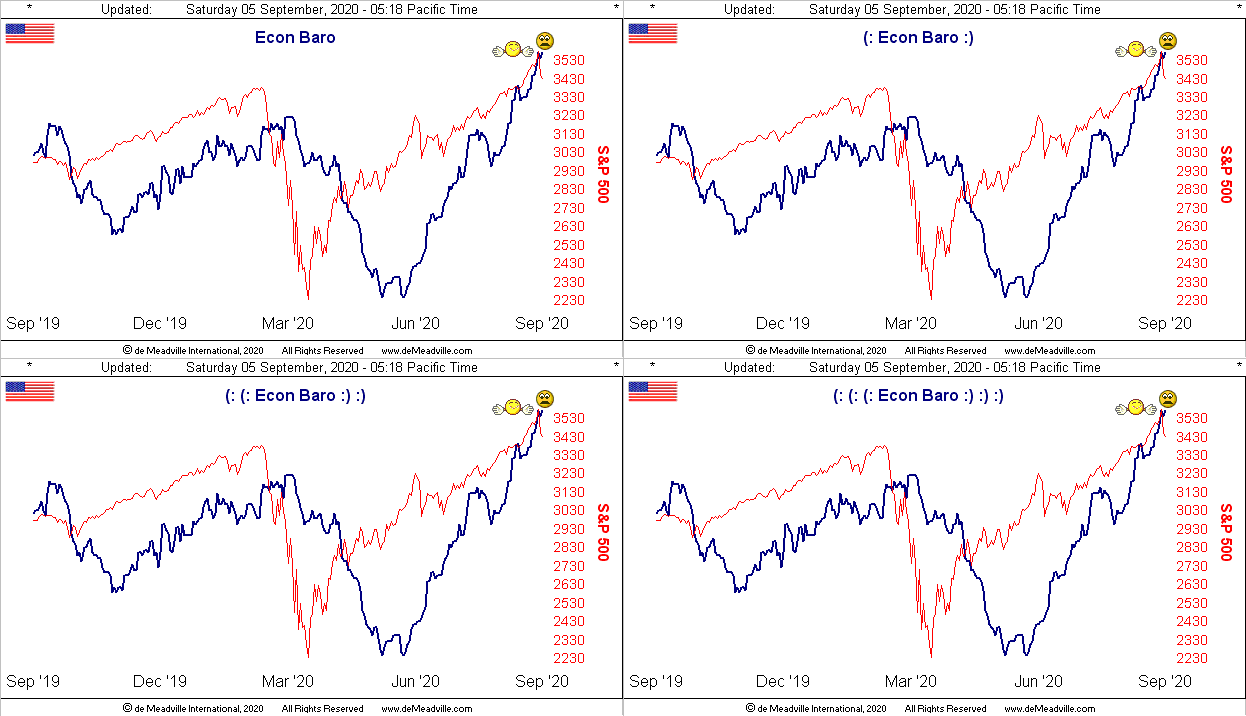
Yet from negative to positive continues the oscillation of the Economic Barometer. The past week's stream of 15 incoming metrics found 10 as net positive for the Baro, notably including August's reduction in Unemployment, the Institute for Supply Management's expanding Manufacturing Index, and growth in Truck Sales. Q2's Productivity was significantly revised upward from +7.3% to +10.1%. Private sector payrolls by ADP's measure doubled from July into August, albeit overall job growth was slower by the Bureau of Labor Statistics reading. Negatively, July's Trade Deficit succumbed to its widest gap since that from September 2006. Still all-in-all, the rapid ramping up of the StateSide economy has pushed the Baro to its highest level since December 2018.
Congrats on that; but the S&P just went "Splat!"... (Clearly all those corporate execs dumpin' their shares last week must have seen our "live" price/earnings ratio for the Index having exceeded 60x ... 'tis today still a torrid 58.2x): Here's the Baro with the S&P 500 (red line) from one year ago-to-date:
Meanwhile have you been minding yields? That for the 30-year "risk-less" U.S. Treasury Bond since 06 August has increased from 1.165% to 1.470% today. Our yield for the "risk-full" S&P 500 is 1.660%. Decision time? Yeah, the Bond ain't sexy, but...
'Course broadly, Gold and certainly Silver are the better bets, notwithstanding negative near-term seasonality, should such spectre of this decade persist. Meanwhile, policy cross-currents are swirling 'round the hallowed halls of the Eccles Building, the print-happy Federal Reserve folks echoing this sentiment versus that sentiment. A week Wednesday (16 September) brings their next policy statement. (Mind those margin requirements, you traders out there! We expect an explosive day, regardless of way...)
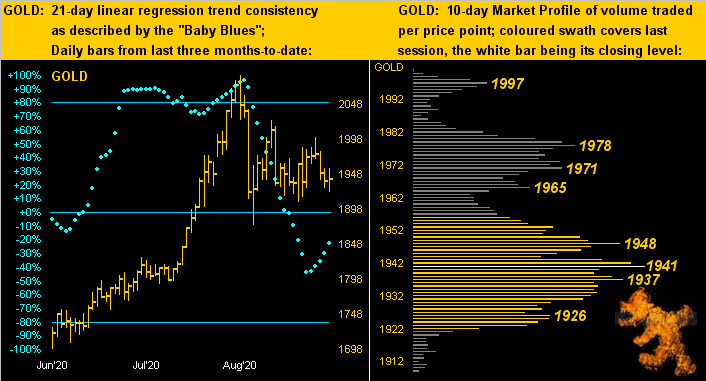
Mind, too, Gold's present stance per the following two-panel graphic. We above viewed Gold's negative parabolic Short trend by the weekly bars; now to the other negative trend by 21-day linear regression as below shown on the left by the daily bars from three months ago-to-date. The baby blue dots of trend consistency being sub-0% define it as negative, but the dots turning upward mean less so. On the right in Gold's 10-day Market Profile, we find price buried down in the belly of the beast. As we've noted in recent missives, should the low 1900s let go, the first notable structural foothold is 'round 1830:
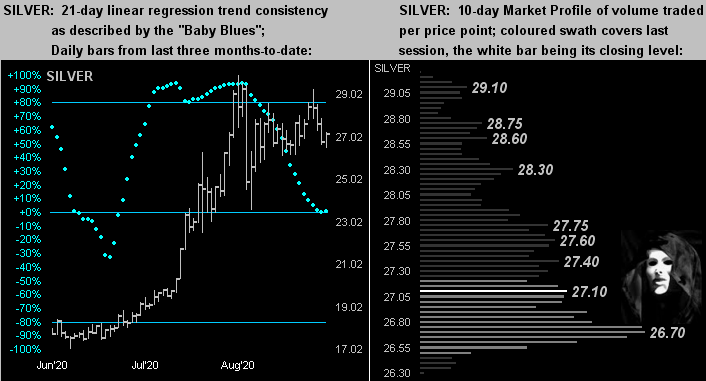
As for Sister Silver, her 21-day linear regression trend is at present flat per her "Baby Blues" (below left) sitting smack on their 0% axis. Surely Silver has fared far better than has Gold of late. Since the Gold/Silver ratio closed at 124.2x back on 18 March, the price of Gold today (1941) is +31% ... but the price of Silver is +126%! In turn, their ratio today is 71.6x (the average since 2001 being 66.1x). As for Silver's Profile (below right), is she masquing her gloom in feeling down?
In summary for Gold, the Labor Day to Thanksgiving run is set to unfold. 'Twas jolly through the Century's first decade; but throughout this second decade, such folly run has found Gold undone.
The near-term technicals are negative, the broad-term fundamentals are positive. Moreover, is shorting Gold still a bad idea? Absolutely 'tis! Better to buy Gold as a bargain than be caught Short without margin!