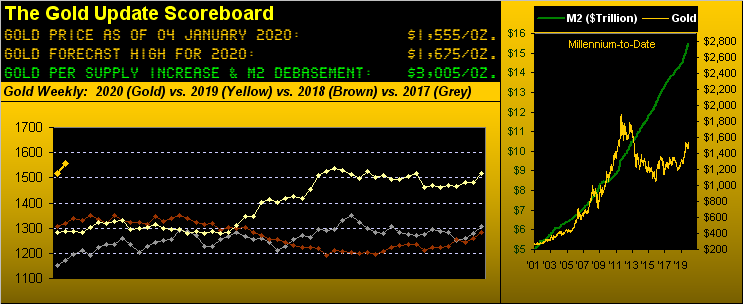
With two 2020 trading days under our belt (and hopefully you can buckle yours post-holiday), we find Gold at 1555, up a swift 2.3%. To achieve the above Scoreboard's forecast high for this year of 1675, price en route shall have to find itself up 10.2%, a gain similarly achieved during six of the past eight years following Gold's All-Time High of 1923 in 2011. But from the "Nothing Goes Up In A Straight Line Dept.", only once since then (in 2016) did Gold not trade below the prior year's close, which for 2019 was 1520.
"But mmb, Gold gapped up to start this year and has gone even higher on the Middle East stuff..."
To be sure 'tis the case right out of the new year's chute, Squire. However as we've oft cautioned, geo-political events that abruptly push Gold higher then tend to find price having wandered back down from whence it came as the short-attention span newsflow shifts, geopolitics giving way to those and other issues at home.
As well, from last week's missive our call for 1675 "...may seem conservative to some..." 'Tis not as if that price is in "uncharted territory" as was the case back in 2011 when the yellow metal was ascending unfettered like a hot knife through butter such that we actually wrote of "Gold having gotten ahead of itself". But when markets return to levels of the past, pricing structure comes into play, that very 1650-1700 zone again being rife with fits n' starts n' support n' resistance. Yes, we expect Gold to get there, but 'tis the what then happens from there that counts, luv.
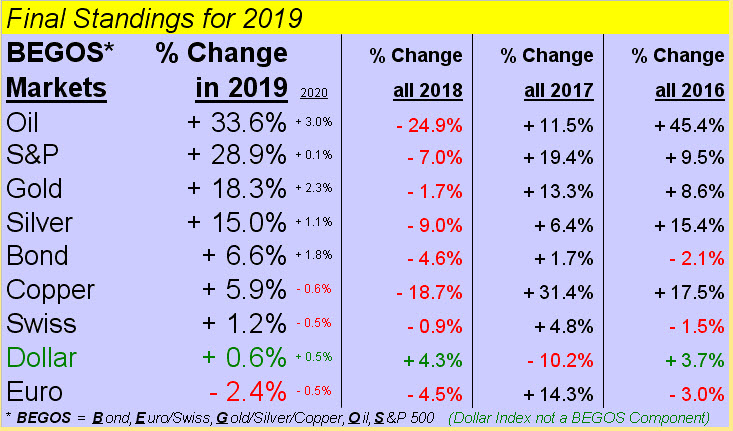
As to the final accounting for the BEGOS Markets in 2019, here is the year's tally, along with a wee column for just the first two trading days so far in 2020. Oil (+34%) ruled the roost last year and is taking off right where it left off with a spritely 3% gain. Naysayers of the S&P (+29%) and Gold (+18%) not being positively correlated can note their respective gains in rounding out the podium for these top three markets. As for fourth-place Silver (+15%), such gain is terribly underwhelming with respect to Gold's performance, as continues to be made stark by the Gold/Silver ratio finishing 2019 at 84.9x vis-à-vis the 2001-to-date average being 65.0x. The year's sole loser? The euro (-2%). Here are the standings:
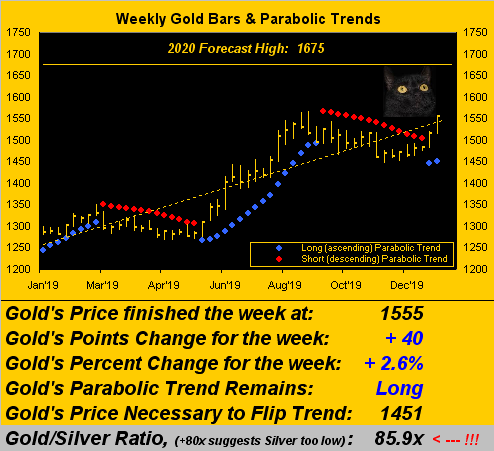
Turning specifically to Gold's weekly bars from a year ago-to-date, so far they're lookin' great. We've cleaned up the chart a bit, ridding past key levels achieved during 2019 in anticipating Gold's 2020 drive to 1675. The initial key here is that by staying above November's 1446 low, Gold ought be good to go. "Eyes up!" don't you know:
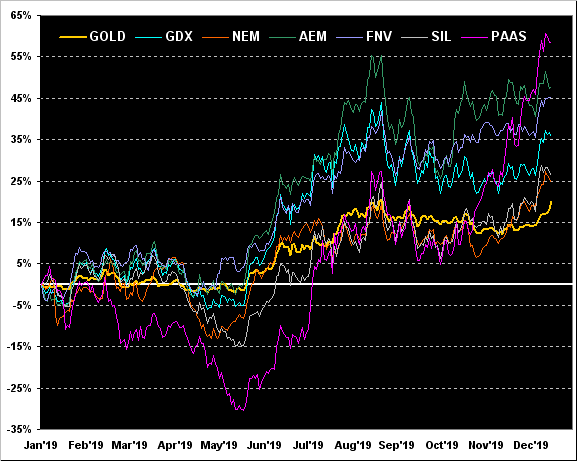
Next let's go year-over-year for Gold along with the best from the precious metals equities' nest. And as goes the sports expression "from worst to first", have a look at Pan American Silver (PAAS) +59% from a year ago. Moreover as measured from its 30 May low of 10.26 to its 31 Dec high of 24.02, 'tis +134%; (Silver itself for that same interim period low-to-high was +27%). Indeed for the balance of the bunch, equities leverage is finally shining through across the chart as we've Agnico Eagle Mines (AEM) +48%, Franco-Nevada (FNV) +45%, the VanEck Vectors Gold Miners exchange-traded fund (GDX (NYSE:GDX)) +36%, the Global X Silver Miners exchange-traded fund (SIL) +26%, Newmont Goldcorp (NEM) +25%, and the least of the bunch Gold itself +20%. That's our kind of "least", right there:
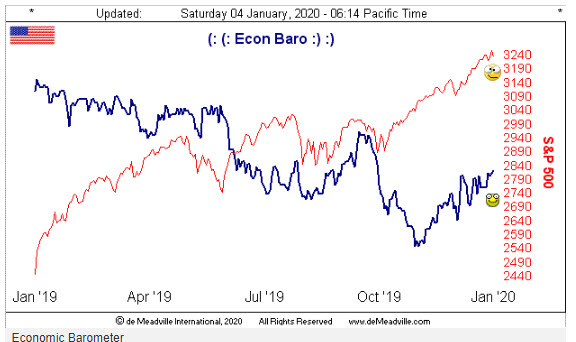
From least we morph to most as per the Conference Board, CEOs see recession as the biggest economic risk, (when would it not be?), their summarization stating concerns over "continued uncertainty around global trade, increasing competition, global political instability, and tightening labor markets." All legitimate considerations certainly, but to look at the Economic Barometer, the rightmost two-month trend clearly is up, the stock market itself as measured by the S&P 500 being up and off the top of our chart, (save for the ability to rescale one's axis). All of this courtesy of the "Everything's Great Until It Ain't Dept." Further, Gold "knows" the ever-expanding 3Ds of Debasement, Debt and Derivatives shan't ever be made whole, in turn contributing to price's upside roll. As for now, here's the Baro:
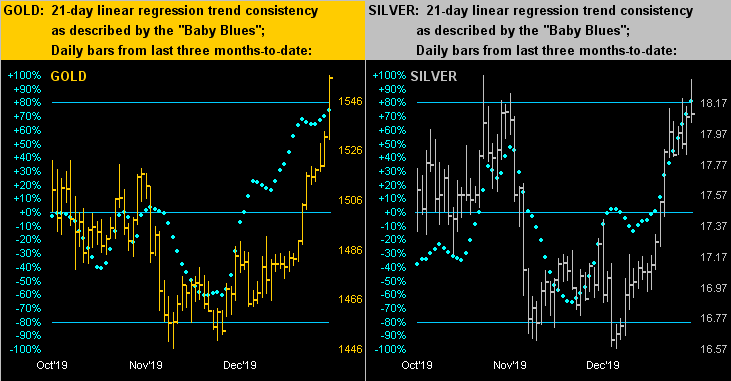
Follows are the day-by-day tracks of the precious metals from three months ago-to-date, the bars thereto of late have been heading up straight as we see for Gold on the left and for Silver on the right. In both cases the baby blue dots of linear regression trend consistency are heading toward +80% axis territory, technically affirming the respective uptrends. Gold (at present 1555) is much closer (within 1%) of its 2019 high (1566) than is Silver (at present 18.10) being farther (some 9%) from its 2019 high (19.80):
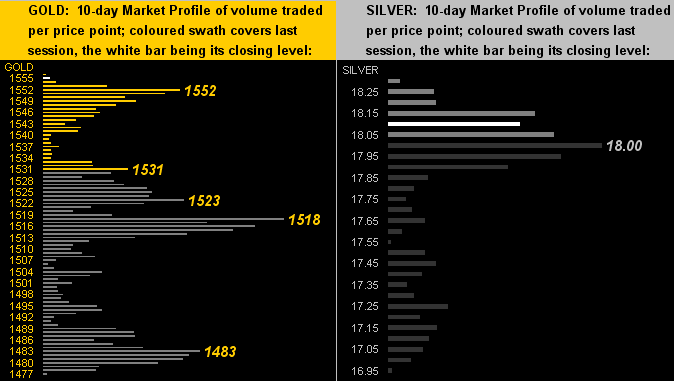
From the nearer-term perspective of their respective 10-day Market Profiles, we've denoted the more volume-dominant trading prices for Gold (below left) and Silver (below right). 'Twould appear 'twill be easier for Gold to stay above 1518 than for Sister Silver to tread her 18 handle. Indeed the yellow metal sustained on Friday almost all of its gain whilst that for the white metal almost entirely waned:
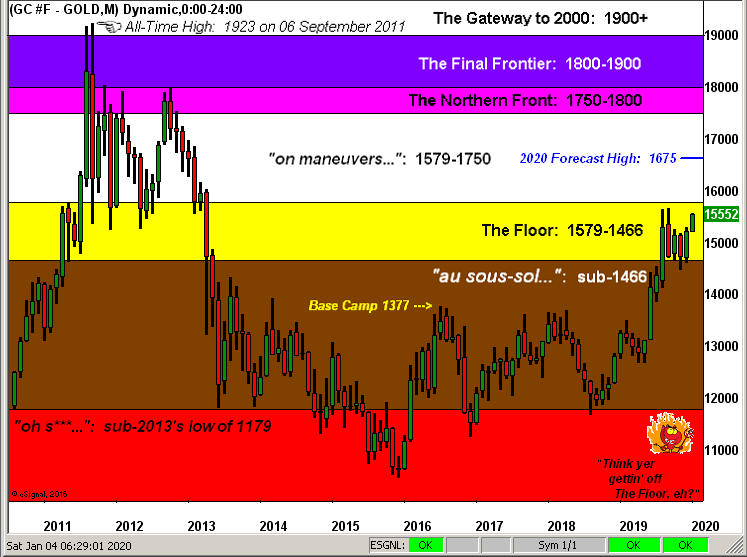
Finally, having passed through month's end, year's end, and (for the mathematically-challenged) decade's end, 'tis time once again to bring up our broad-based graphic of Gold's Structure, its bars being by the month and key strata as therein defined. Clearly Gold has clambered up from the basement (sous-sol) such as to rest at long last upon The Floor through which it rather unglamourously fell back in 2013. Obviously as 2020 unfolds we see Gold moving midway up into the "on maneuvers" zone, the forecast 1675 high as displayed in blue. Whoo-Hooo!
In closing, indeed in risking belabourment of the well-overargued point that the new decade has or hasn't begun, we respectfully park ourselves in the latter camp, as does the Farmers' Almanac, the United States Naval Observatory, and those who can properly count. Still, and notably since Al Gore's having invented the Internet, (exacerbated by the non-crisis of "Y2K" which occurred one year before the actual turn of the millennium), folks have a fascination with the 10s digit (which for you WestPalmBeachers down there is the second number from the right in whole numbers greater than nine) ratcheting up a notch, the present case having just been 2019 turning to 2020. 'Course by the Gregorian calendar, years ending in 0 ("zero") are technically decade-enders, (not decade-starters). For example, after living for one year, your age is not zero, 'tis one; after ten years, your age is not nine, 'tis ten. Congratulations: you're one decade old! Or if you've invited ten guests for dinner, as they droolingly come through the door, you count them from one through ten, not from zero through nine: the tenth guest is the last one of the invitees; the tenth year is the last one of the decade. See how easy 'tis? Either way, this is certain: neither was there a "Year Zero", nor shall Gold every trade at such price! So let's close this decade with Gold's drive to 1675!