Wednesday was no different than days past when the S&P 500 gapped higher and then gave back all the gains throughout the day to finish lower by around 20 bps. We may be in the early phases of resolving this stalemate between buyers and sellers, with the S&P 500 finally breaking the uptrend on the rising wedge pattern before the close.
Also, as you can see, the green line has served as resistance for the index a few times. That trend line, of course, is the March 2020 uptrend. Unless something changes dramatically today, that uptrend is now looking as if it is broken for good.
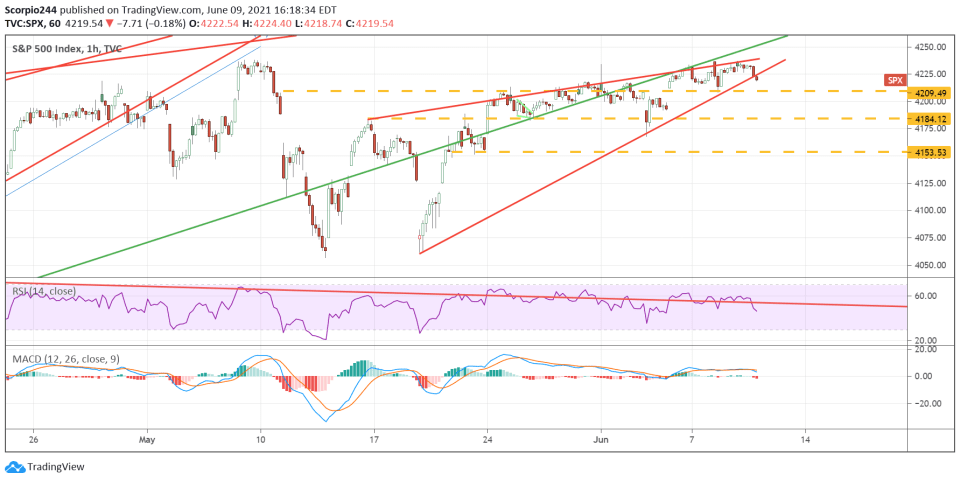
If the 2020 trend line is indeed broken, then the monster’s rising wedge pattern going back to 2019 is now broken.
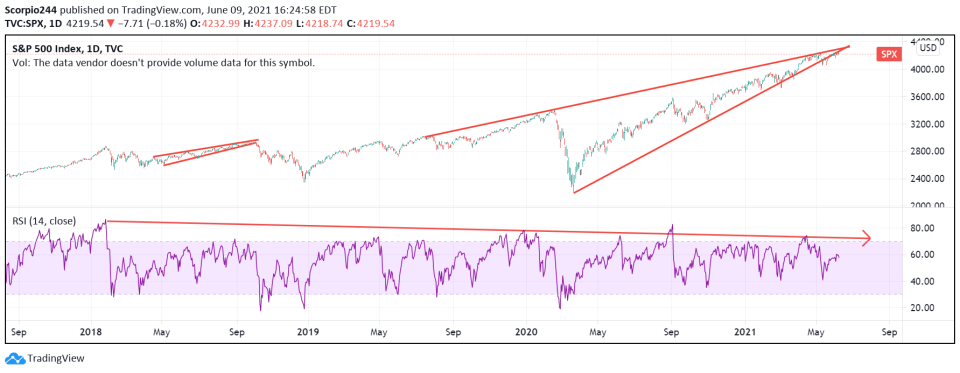
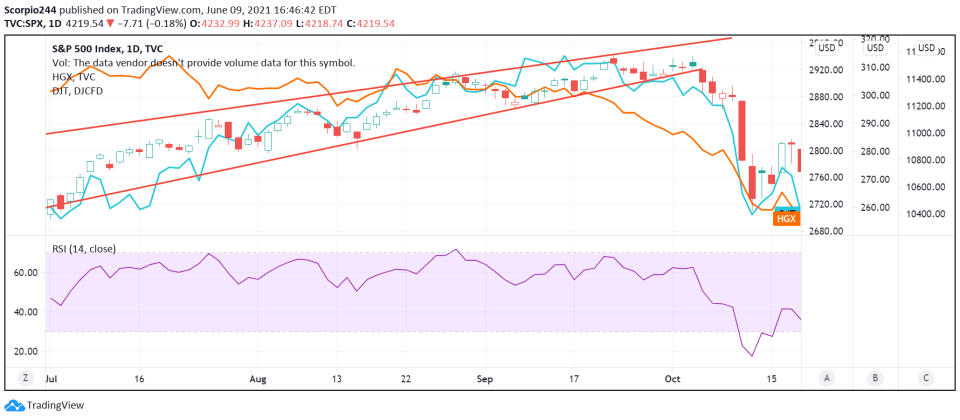
This rising wedge pattern has a lot of similarities to that of 2018. In fact, there was a rising wedge pattern in the S&P 500 going into October of 2018; once the pattern broke, it was pretty much lights out.
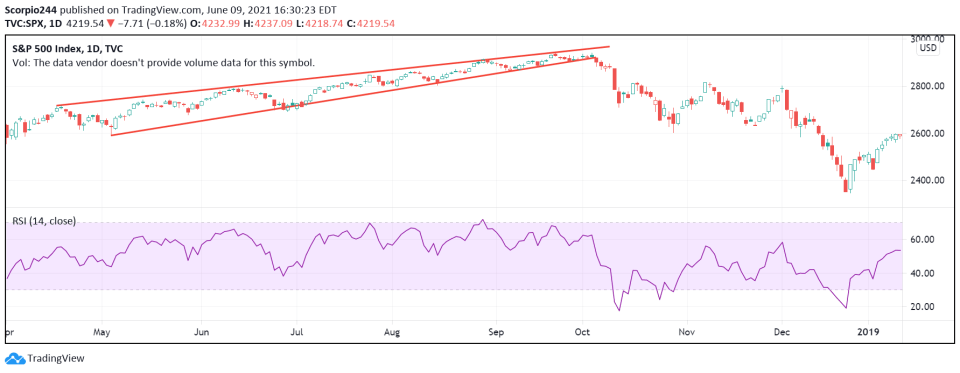
While one can argue, things were different back then because we were in a Fed tightening cycle, I would argue they are not that different at all.
In 2018, the fear was the Fed would over-tighten, causing growth to stall out or perhaps even cause a recession. But really, the underlying concern of slowing growth back then is the same as today. As I have been writing for weeks now and noted in my latest tactical updates, next year’s growth rate is expected to drop dramatically.
In fact, in 2018, you know what led the S&P 500 lower, the transports, and the housing sector. The housing stocks and the transports both started to turn lower just before the S&P 500 did back then.
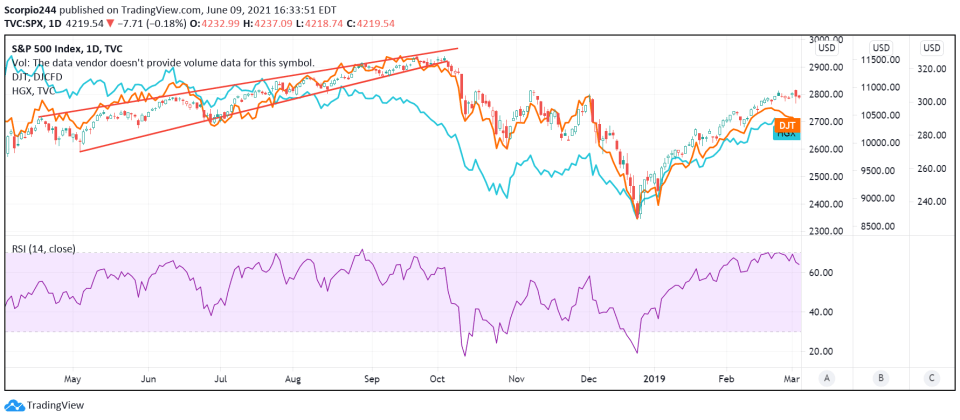
You know which two sectors had brutal days, both finishing lower by more than 1%, housing and transports. That adds to a brutal couple of weeks.
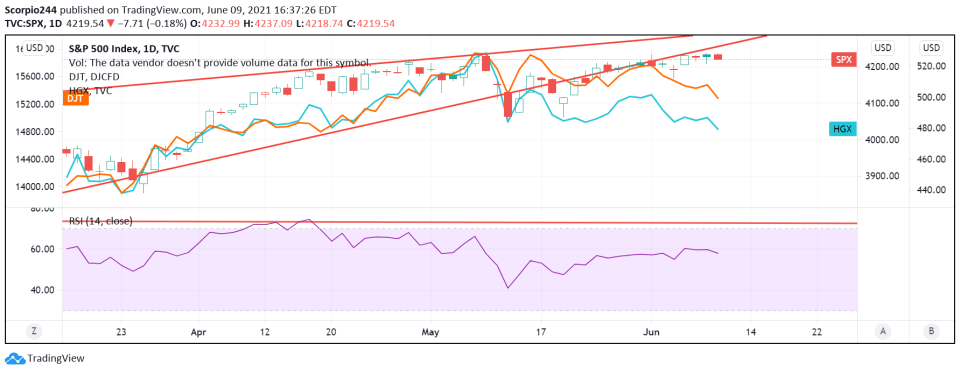
If you look really closely, in 2018, the S&P 500 stalled out for several days as the DJT and HGX began to diverge lower. It doesn’t look all that different today.
Reflation Trade May Be Done
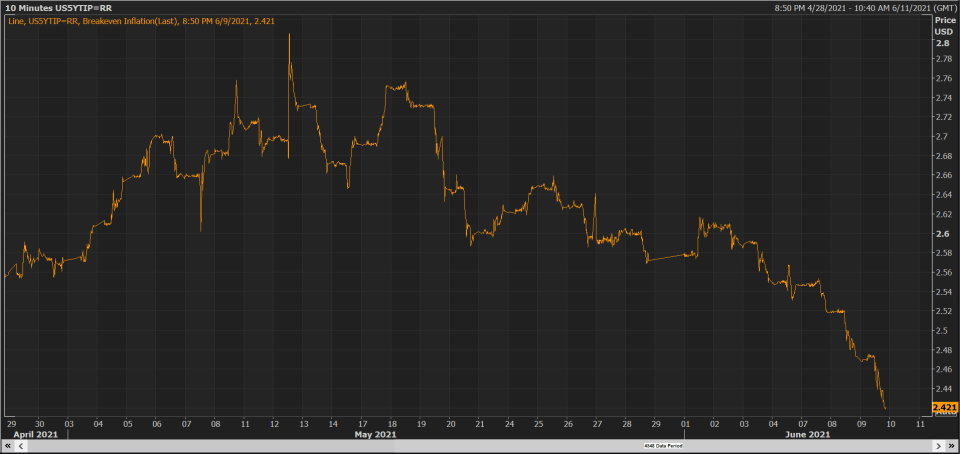
The big problem for the market right now is that inflation expectations are collapsing. The 10-Year Breakeven Inflation Rate inflation rate is now at 2.32%, and the 5-year breakeven rate is at 2.42%. In fact, the 5-year TIPs yield rose today by 7 bps to -1.69%.
If you are not taking notice, you better because something is happening here, and it is a clear signal for the reflation trade, which appears to be breaking down.
JPMorgan
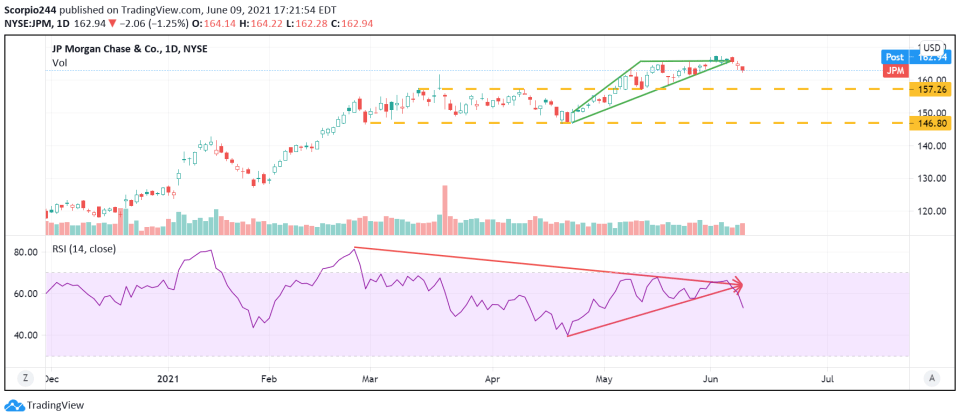
JPMorgan Chase & Co (NYSE:JPM) broke the diamond pattern yesterday and was heading lower to $157.25. The RSI broke the trend too and took out its recent lows. This was confirming the lower price action in the stock.
UPS
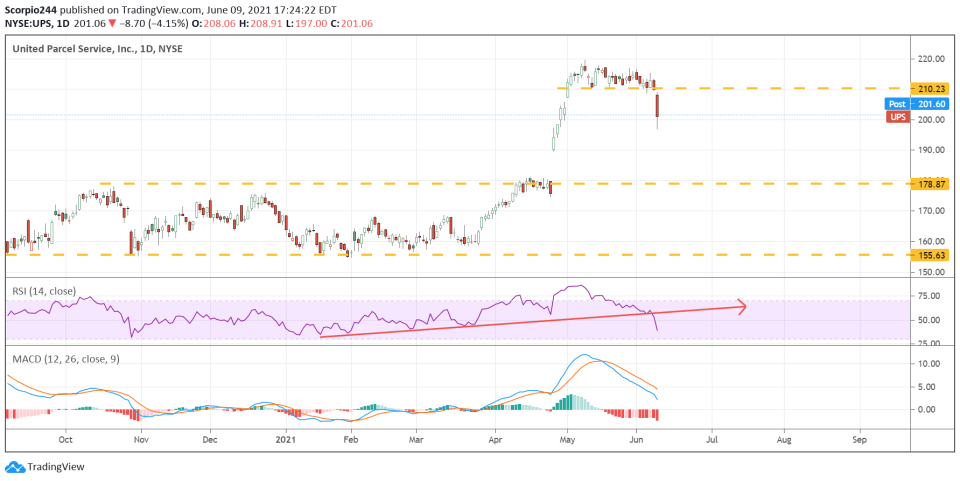
United Parcel Service Inc (NYSE:UPS) was crushed Wednesday after giving inline guidance for 2023. There may be an underlying message here, but on the surface, that message seems to suggest that upside surprises may not exist in the future and that this is the best it will get; that is my takeaway.
The stock fell below support at $210, and that gap at $178 is just screaming to be filled.
Micron
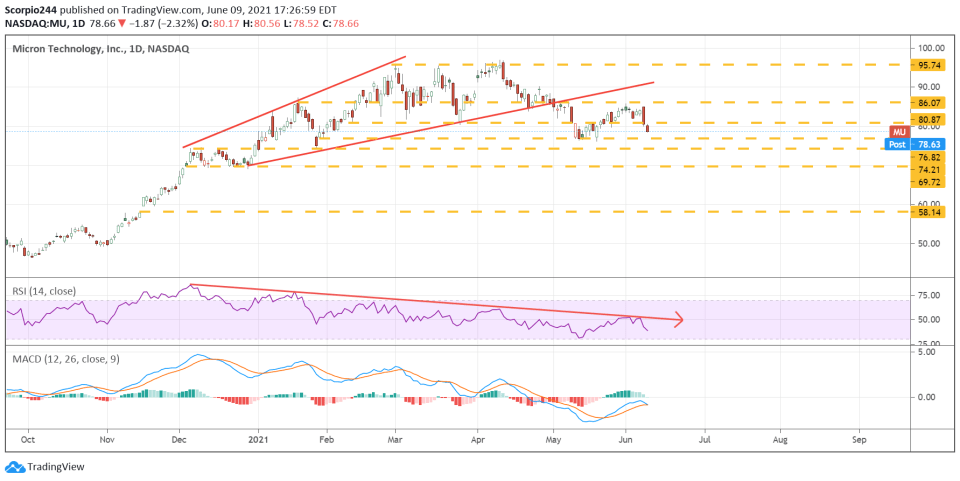
Micron Technology (NASDAQ:MU) was down another 2% yesterday, and there were many bearish options betting on this one the previous day. This stock appeared to be heading for around $76, although the put options suggested an even lower price by the middle of August.

