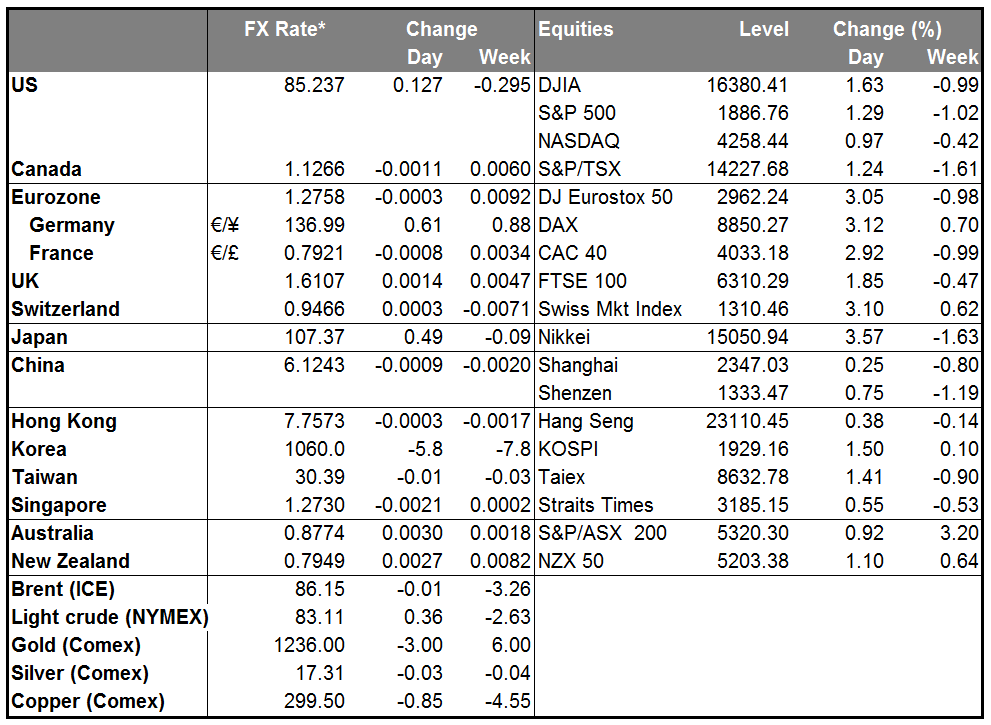
Last week was really remarkable. So much action to go nowhere! Ten-year Treasury bonds had a 10-sigma day Wednesday and over the week had a 42 bp range, yet they finished Friday at 2.20%, compared to 2.28% a week earlier. The S&P 500 had a 5% range on the week but in the event finished the week down only 1%, with the VIX almost unchanged for the week at 22, even though the high for the week was 31. And the dollar index was down 0.2%, not much considering the rout we saw on several days. The US currency has even gained over the last week against NOK, CAD, JPY and GBP.
What calmed the market? In part, some half-hearted encouragement from the ECB. Council Member Coeure said the Eurozone is in “crisis times,” but although Nowotny said on Thursday the purchases would start in December “at the earliest,” Coeure said they will start buying ABS and covered bonds “within the next days.” Even uber-hawk Jens Weidmann got in the act, saying that the “ECB asset purchases suggest a shift to QE philosophy,” although he doesn’t necessarily think that’s a good thing. The gist of all these comments appears to be that the ECB is moving toward some approximation of QE in the not-too-distant future, which the markets found encouraging even if some members of the ECB Council clearly aren’t that happy with it. Meanwhile, things calmed down in Greece, where 10-year bond yields fell 90 bps Friday and the stock market soared around 7%.
The US Fedspeak saw some measure of mean reversion, too. Following Bullard’s surprising suggestion that the Fed shouldn’t end QE this month, the Wall Street Journal’s well-respected Fed reporter, Jon Hilsenrath, said “it is hard to see the Fed following his lead” for the same reason I noted: the Fed has decided on this move and it takes a lot to get them to change. Meanwhile, even the dovish Boston Fed President Eric Rosengren said he sticks to his forecast that rates will start to rise around the middle of next year. Oddly enough, it was Fed Chair Janet Yellen who added the least to our knowledge about the Fed’s view. Her talk on inequality focused, not surprisingly, on inequality, rather than the current economy or monetary conditions. (NOTE: On Friday, I said that Bullard is an extreme hawk. This was incorrect. In fact, Reuters rates him a centrist “3.”) Combined with several better-than-expected US economic indicators, this renewed expectation for the end of QE brought a bid back to the USD.
USD/JPY surged at the end of the US day Friday on a report in the Nikkei that the Government Pension Investment Fund (GPIF) is likely to double its allocation to Japanese stocks to around 25% from the current 12%. The assumption was that the news would send Tokyo stocks higher, and USD/JPY is positively correlated with the Tokyo stock market. Indeed it worked as expected, with Tokyo stocks jumping 3.8% Monday, the biggest daily gain in over a year.
IMM USD longs reached their highest level since May 2013 as all currencies except for JPY and MXN added to their long-USD, short-currency position, but that was before the astonishing moves on Wednesday.
Today’s indicators: German PPI is expected to fall at an accelerating pace indicating that the risk of deflation in Eurozone is worsening. Eurozone’s Current account for August is also coming out. From Canada, wholesale trade sales for August are to be released. There are no major US indicators coming out.
We have one speaker Monday, ECB Executive Board member Benoit Coeure. On Friday he called on Eurozone countries to speed up their structural reforms.
Rest of the week: The main events for the rest of the week are Tuesday’s data from China (see below). Wednesday there is a Bank of Canada meeting (expected to remain on hold at neutral) and the minutes from the latest Bank of England meeting, which will show us whether they’ve softened their stance in response to softer data. Thursday there is a Norges Bank meeting (expected to maintain loose stance) and global PMIs, the first indicators of activity in October. China’s PMI is expected to be unchanged, but the Eurozone is seen lower, which may hurt the EUR.
On Tuesday, China releases its Q3 GDP and retail sales and industrial production for September. The pace of growth is expected to decline a bit, which would corroborate the concerns about a global slowdown. AUD may weaken as a result. The Reserve Bank of Australia releases the minutes of its October policy meeting. The statement accompanying the decision dropped the line that the exchange rate “remains above most estimates of its fundamental value.” Yet it included the comment that the rate “remains high by historical standards,” as it did several times before. It is unlikely that the minutes will show a different picture.
The Market
EUR/USD pulls back again
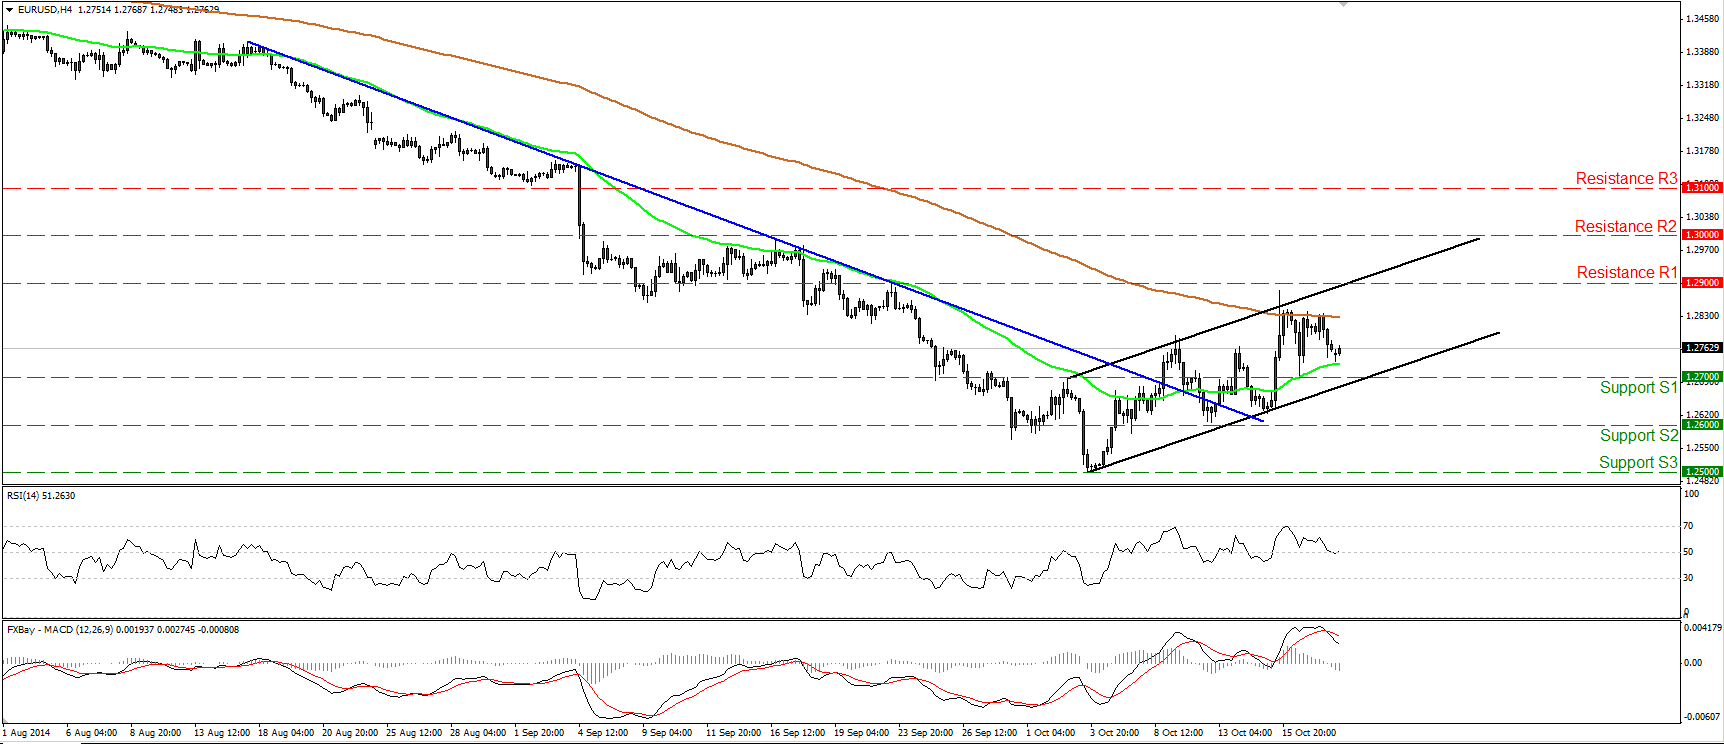
EUR/USD moved lower on Friday after finding resistance near the 200-period moving average. However, the fall was halted above the 1.2700 (S1) line, near the 50-period moving average. As long as the rate remains within the upside black channel and above the prior downtrend line, I still see the possibility that the recovery from 1.2500 (S3) may extend higher. Hence, I would consider the short-term bias to remain cautiously positive. But only a clear break above the 1.2900 hurdle could trigger a strong leg up, in my view, perhaps towards the psychological line of 1.3000 (R2). As for the bigger picture, on the daily chart the price structure still suggests a downtrend, thus I retain the view that the near-term advances are a corrective phase of the longer-term down path.
• Support: 1.2700 (S1), 1.2600 (S2), 1.2500 (S3).
• Resistance: 1.2900 (R1), 1.3000 (R2), 1.3100 (R3).
EUR/JPY breaks above 136.70
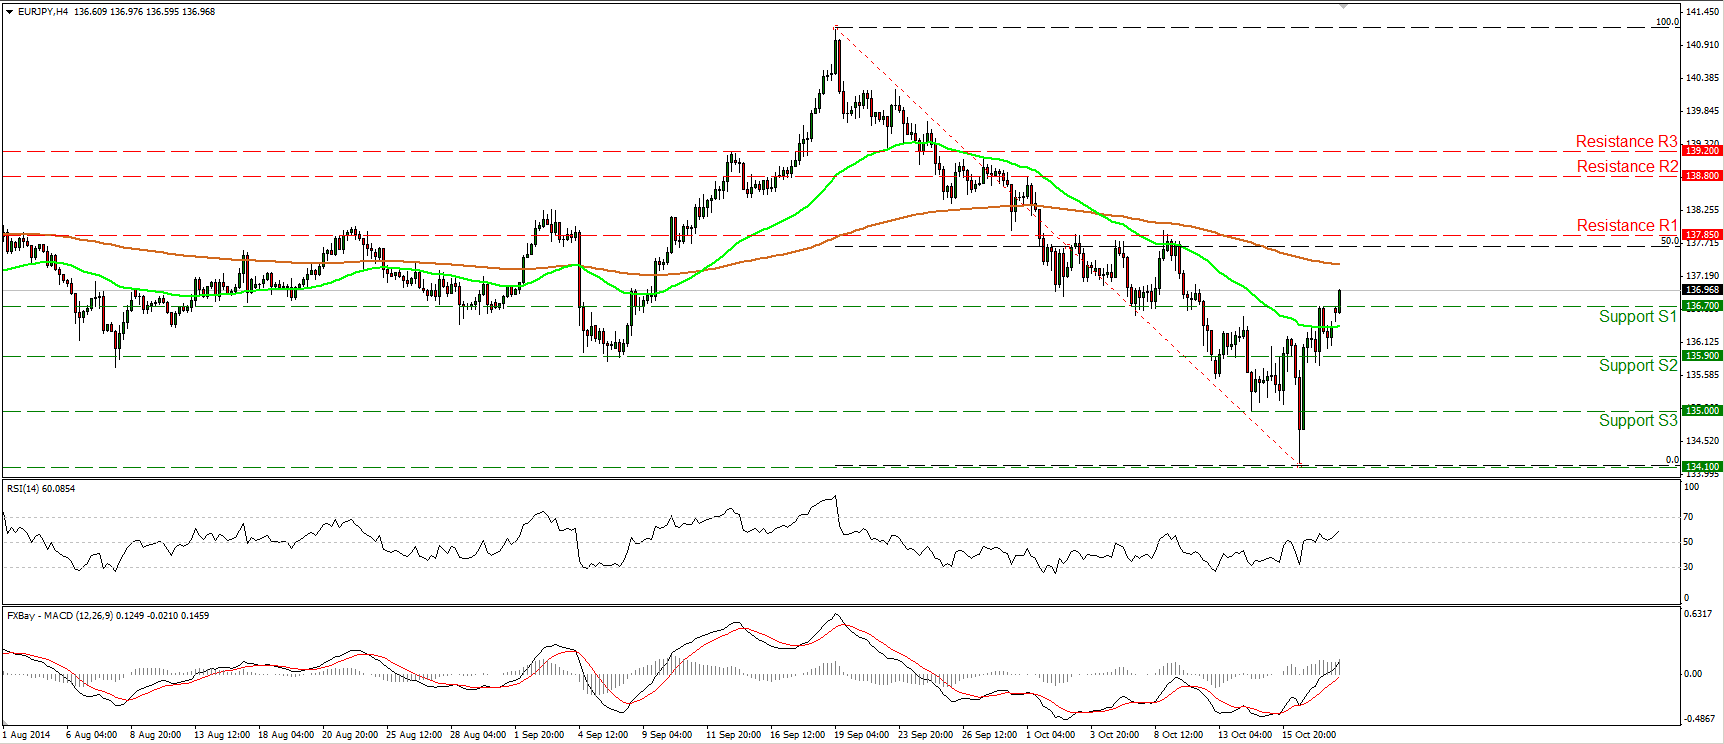
EUR/JPY moved higher on Friday and today, during the Asian morning, the bulls managed to violate the resistance (turned into support) hurdle of 136.70 (S1). I would expect such a move to set the stage for extensions towards the next obstacle at 137.85 (R1), which lies near the 50% retracement level of the 19th September – 16th October decline. Our short-term momentum studies support the notion. The RSI rebounded from near its 50 line and is now pointing up, while the MACD lies above both its zero and signal lines. On the daily chart, the 14-day RSI moved higher and is getting closer to its 50 line, while the daily MACD has bottomed and appears willing to move above its trigger line in the close future, amplifying the case for further upside. However, the rate remains below the 200-day moving average, which currently coincides with the 50% retracement level of the aforementioned down wave, thus I would consider the recent advance or any extensions of it as a corrective move for the moment.
• Support: 136.70 (S1), 135.90 (S2), 135.00 (S3).
• Resistance: 137.85 (R1), 138.80 (R2), 139.20 (R3).
GBP/USD remains below the resistance of 1.6130
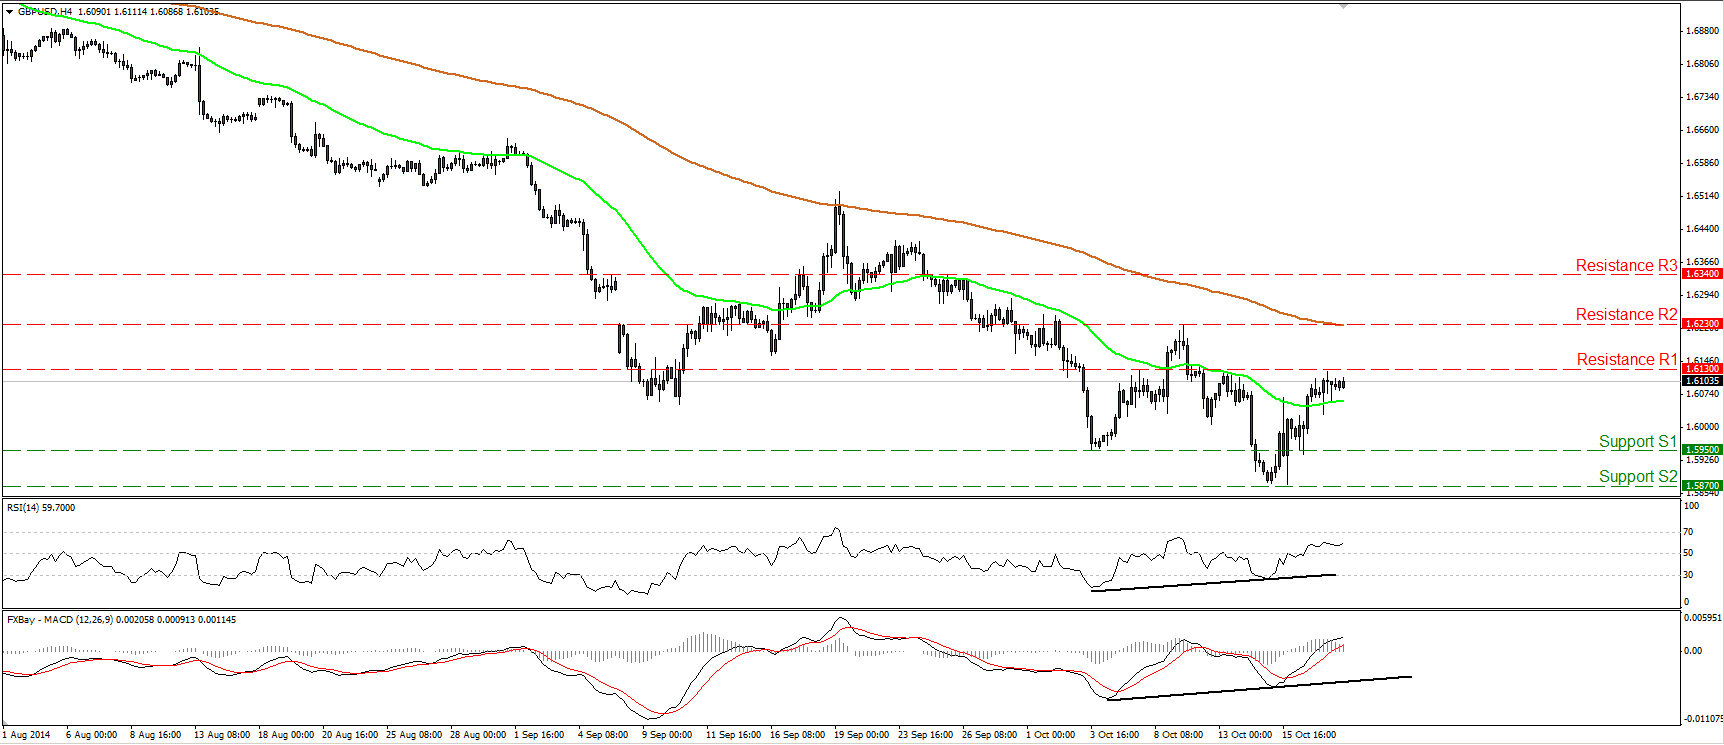
GBP/USD moved fractionally higher on Friday, remaining slightly below the resistance hurdle of 1.6130 (R1). A clear and decisive move above that line could pave the way towards the next obstacle at 1.6230 (R2), which now coincides with the 200-period moving average. The RSI remains above its 50 line and the MACD remains above both its zero and trigger lines, indicating positive momentum. Moreover, on the daily chart, the price appears willing to escape from a falling wedge formation [a move above 1.6130 (R1) is likely to confirm the break out], and I also see positive divergence between the daily momentum indicators and the price action. However, I still believe that as long as Cable remains below the 80-day exponential moving average, the trend remains to the downside. Hence, I would treat any future bullish waves as a retracement.
• Support: 1.5950 (S1), 1.5870 (S2), 1.5720 (S3).
• Resistance: 1.6130 (R1), 1.6230 (R2), 1.6340 (R3).
WTI stays virtually unchanged
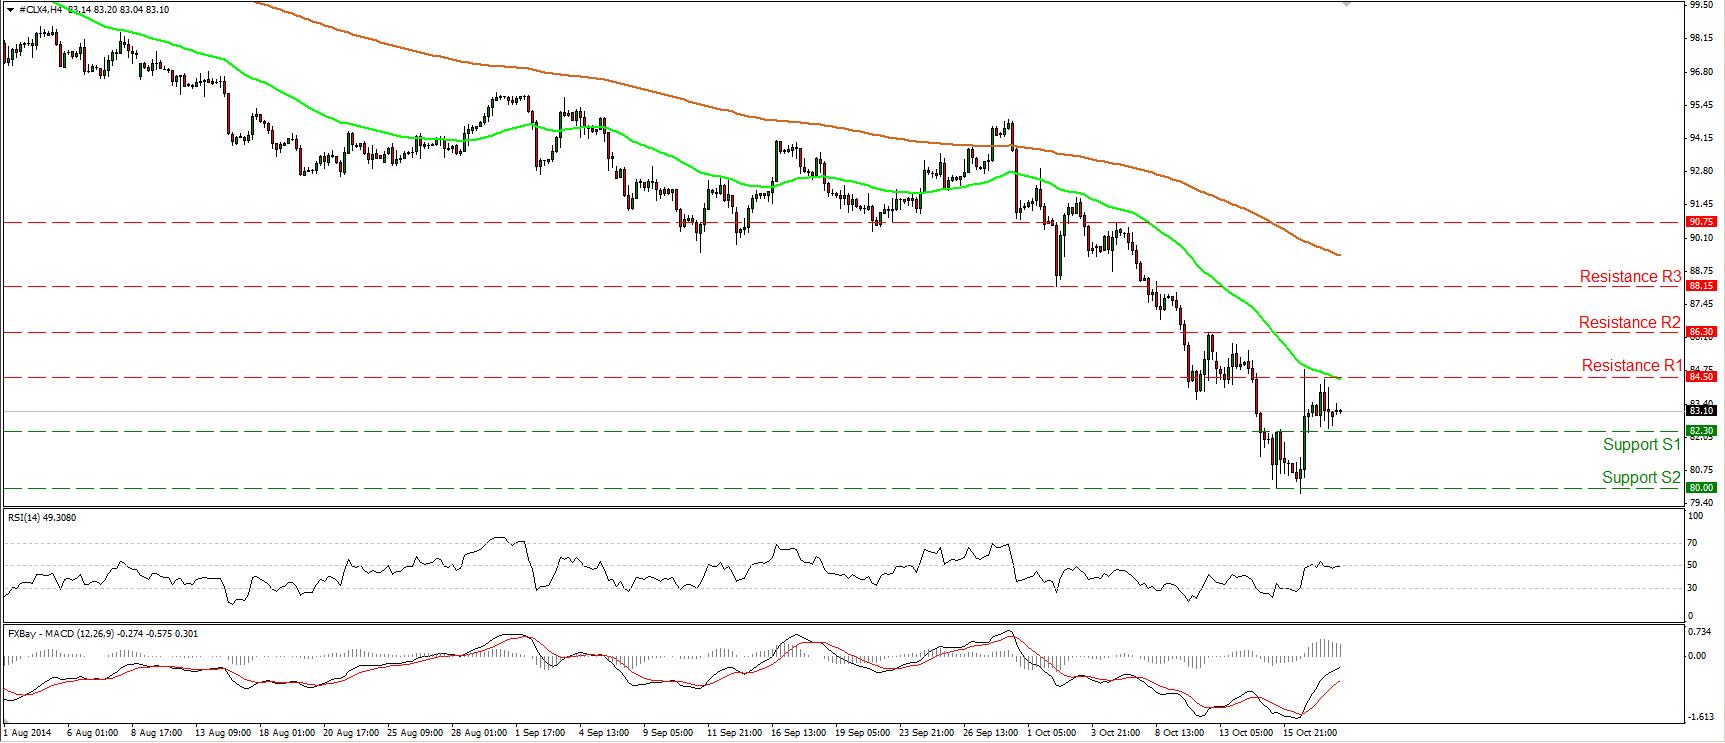
WTI moved in a consolidative mode, staying between the support line of 82.30 (S1) and the resistance of 84.50 (R1). The price structure remains lower highs and lower lows below both the 50- and the 200-period moving averages, keeping the downtrend intact. However, given the strong rebound from the 80.00 (S2) zone on Thursday, I would prefer to adopt a “wait and see” approach for now. On the daily chart, the 14-day RSI exited its oversold field, while the daily MACD seems to be bottoming. These momentum signs give me extra reasons to remain neutral. I would prefer to see a strong move below the psychological hurdle of 80.00 (S2) before getting more confident on the downside. On the upside, a break above 84.50 (R1) could turn the near-term bias to the upside and could target the next resistance at 86.30 (R2).
• Support: 82.30 (S1), 80.00 (S2), 77.50 (S3).
• Resistance: 84.50 (R1), 86.30 (R2), 88.15 (R3) .
Gold moves sideways
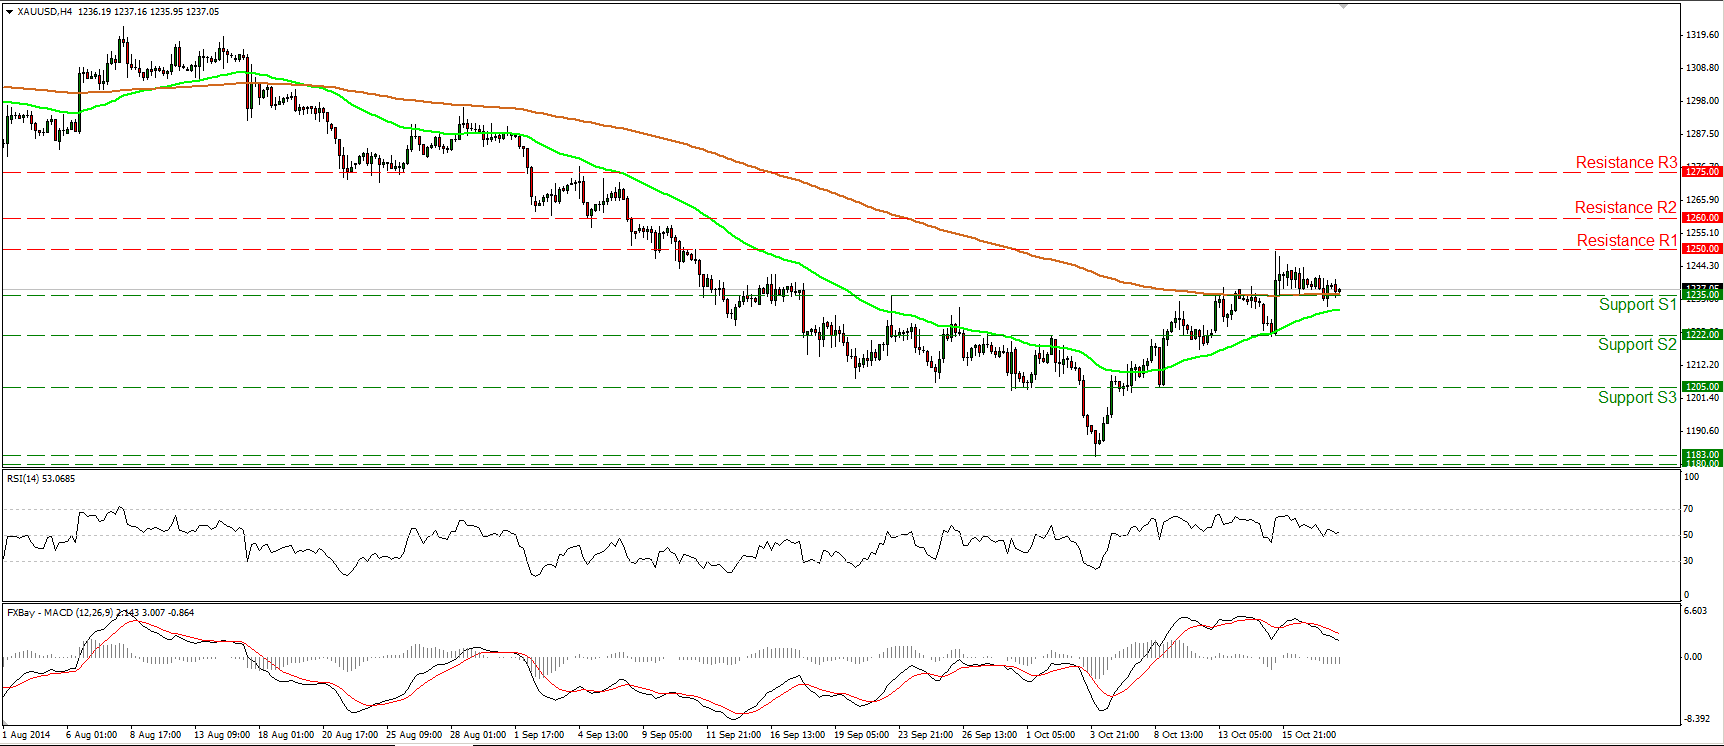
Gold moved quietly on Friday, remaining slightly above the 1235 (S1) line and the 200-period moving average. I still expect the bulls to pull the trigger and target the resistance obstacle of 1260 (R2). On the daily chart, the 14-day RSI remains above its 50 line while the daily MACD, already above its trigger line, is getting closer to its zero line and could get a positive sign in the near future. This supports the scenario for further advances in the near future. Nonetheless, coming back to the 4-hour chart, although the RSI found support at its 50 line, the MACD remains below its trigger and is pointing down. Thus I would remain mindful of a possible pullback before buying pressure prevails.
• Support: 1235 (S1), 1222 (S2), 1205 (S3).
• Resistance: 1250 (R1), 1260 (R2), 1275 (R3).

