The First 1% down day in the S&P 500 since October 11th.
Finally, we are seeing the equity market correct. Traders have been waiting months for this, but I doubt it was everything they had hoped for. Although it is a relatively decent one-day sell-off, today's action was meaningless in comparison to the post-election night rally. Further, selling was orderly and without panic. The good news is, the market is looking healthier. Corrective trade is "normal" and should be expected. As crazy as it sounds, the market needs to be bearish before traders can get comfortably bullish and buying picks up.
Today's shake-up is being blamed on yesterday's Congressional hearings and today's uncertainty regarding Thursday's health care vote in the House. The Republicans claim they have the 216 votes necessary to pass the bill, but some last minute amendments are raising concerns.
As we've been stating in this newsletter, the markets had priced in political perfection but governments are designed for flawed operations (checks and balances). The financial markets could get rocky as the new administration attempts to administer change.
Treasury Futures Markets

The bulls are in control of Treasuries
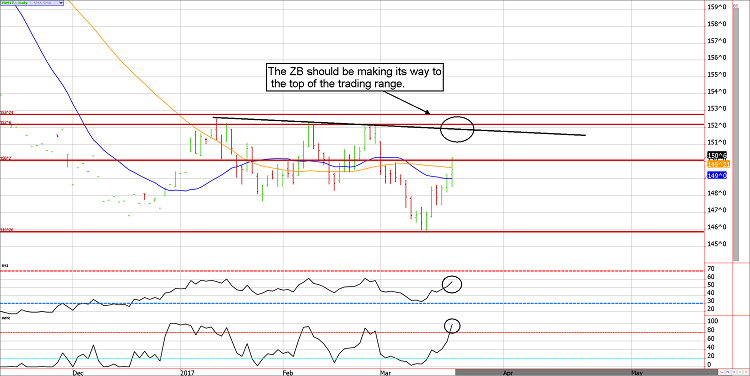
The massive short position held by speculators in the 10-Year note has been slowly unwinding. Although the bears probably think this rally is painfully sharp, it could be far worse.
In fact, given the historical size of the short position, this rally is a little on the disappointing side. Unfortunately, it was also difficult to get positioned on the upside in Treasuries because the bottom occurred in the midst of significant event risk (non-farm payrolls and the FOMC meeting). Nevertheless, we believe the trend will continue for now. The ZB and the ZN should be headed for the upper end of the trading range, respectively 152'0 and 125'15.
Treasury Futures Market Analysis
**Bond Futures Market Consensus:** The trend should continue, at least until running into resistance near 152'0 in the ZB and 125'15 in the ZN.
**Technical Support:** ZB : 147'15, 145'20 ZN: 123'10, 122'15 and 121'29
**Technical Resistance:** ZB: 150'01, 152'06, and 152'25 ZN: 125'02, 125'16, and 126'0
Stock Index Futures Markets

Today felt like the end of the world for ES bulls, but it wasn't
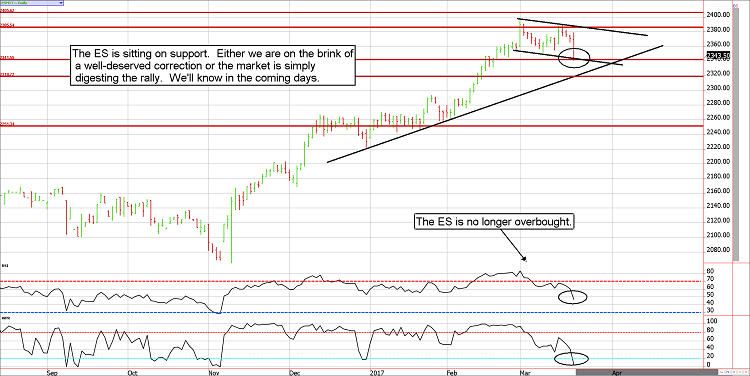
The general public has become spoiled by the lack of volatility and the never-ending stock market rally. Today's mere 1% decline seemed like a game-changer to many but it simply wasn't a big deal. The S&P is only four days out and 40 S&P points from it's last print near an all-time high.
If you are a bull, don't panic. If you are a bear, don't get overly excited. Today's trade doesn't mean much in the big picture. However, the e-mini S&P is sitting on support near 2340ish. If this level breaks, the bears might finally get what they've been looking for. If not, don't be surprised if the market bounces right back to resume the uptrend. In short, the market is at a significant crossroads.
On a side note, a client pointed out an interesting stat: In 21 of the last 22 occasions the S&P has been up through March 15th of the current year, it has been up at the end of the year. In most cases, the gains far exceeded those posted by the March 15th measurement point. The only exception was 1987.
Stock Index Futures Market Ideas
**e-mini S&P Futures Market Consensus:**
2340ish support will be a deciding factor on whether the rally continues, or we go deeper into correction territory.
***These figures are based on March, we'll switch to June next week***
**Technical Support:** 2340, 2318, and 2251
**Technical Resistance:** 2385 and 2405
e-mini S&P Futures Day Trading Ideas
*These are counter-trend entry ideas, the more distant the level the more reliable but the less likely to get filled**
ES Day Trade Sell Levels: 2367, 2378, and 2390
ES Day Trade Buy Levels: 2340 and 2318
In other commodity futures and options markets....
October 6 - Buy March Euro strangles using the 123 calls and the 100 puts for about $400. This trade is looking for a sharp increase in volatility.
January 27 - Buy a June ZN (10-year note) future near 123'16.5 and sell a 123 call for about 1'50. Risk is unlimited under 123, reward is about $1300 at expiration if the futures price is above 123'0.
February 15 - Let's add to our short ES call position by selling the April 2400 call for about 10.00
February 27 - Lock in a profit of $650 to $700 per contract on the ZN covered call. We'll try to get back in on a big dip.
February 27 - Sell April natural gas $2.45 put for about 40 ($400).
March 1 - Roll the April ES 2375 calls into double the quantity of May 2450 calls, and purchase a March 2450 call for insurance. This should be close to even money.
March 1 - Roll the April ES 2400 call into April 2430 calls, this leaves about 17 points on the table, but lowers risk and margin.
March 1 - Buy back the April nat gas 245 put to lock in a quick gain of about $230 per contract.
March 9 - Exit April 2430 calls to lock in gain (which was recouping losses from the original venture) and reduce risk ahead of payrolls.
March 9 - Sell June Lean Hogs future near 77.00 and then sell a June 78.00 put. This offers are well-hedged bearish position with a profit potential of about $1300 but unlimited risk above 81.00.
March 9 - Buy July soybeans $11.80 call for 7 cents or $350. This represents the total risk of the trade prior to transaction costs.
March 14 - Buy back half of the May 2450 calls to lock in a gain (which recoups previous losses) and lessen the risk ahead of the FOMC.
March 21 - Buy back the last of the short May 2450 ES calls to lock in a gain. Most clients came out near a wash or with a small loss after everything was said and done.
**There is substantial risk of loss in trading futures and options.** These recommendations are a solicitation for entering into derivatives transactions. All known news and events have already been factored into the price of the underlying derivatives discussed. From time to time persons affiliated with Zaner, or its associated companies, may have positions in recommended and other derivatives. Past performance is not indicative of future results. The information and data in this report were obtained from sources considered reliable. Their accuracy or completeness is not guaranteed. Any decision to purchase or sell as a result of the opinions expressed in this report will be the full responsibility of the person authorizing such transaction. Seasonal tendencies are a composite of some of the more consistent commodity futures seasonals that have occurred over the past 15 or more years. There are usually underlying, fundamental circumstances that occur annually that tend to cause the futures markets to react in a similar directional manner during a certain calendar year. While seasonal trends may potentially impact supply and demand in certain commodities, seasonal aspects of supply and demand have been factored into futures & options market pricing. Even if a seasonal tendency occurs in the future, it may not result in a profitable transaction as fees and the timing of the entry and liquidation may impact on the results. No representation is being made that any account has in the past, or will in the future, achieve profits using these recommendations. No representation is being made that price patterns will recur in the future.
