State Of Affairs In Financial Markets — Jan 31
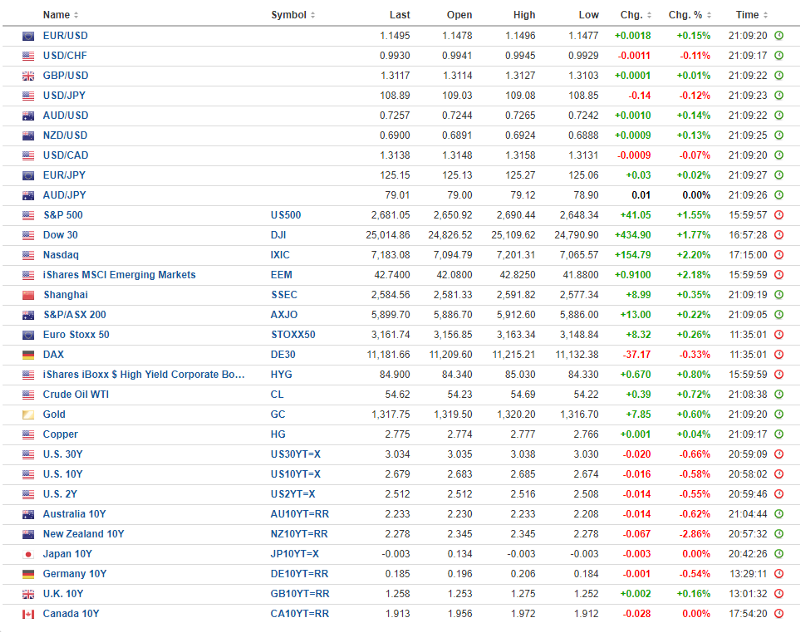
The overarching theme dominating moves in financial markets is the dovish signal sent by the Fed on Wednesday, further acknowledging that rate hikes are no longer top of the list, with patience being reiterated, while also making the admission that a potential review of the balance sheet normalization guidance. The Fed has gone full circle from constructively hawkish just a few months to an undeniably dovish stance. When we look back years from now, the sequence of events that unfolded since the aggressive tightening of financial conditions in the U.S. would be an excellent case study on how market forces, ultimately, will determine the course of action by a Central Bank.
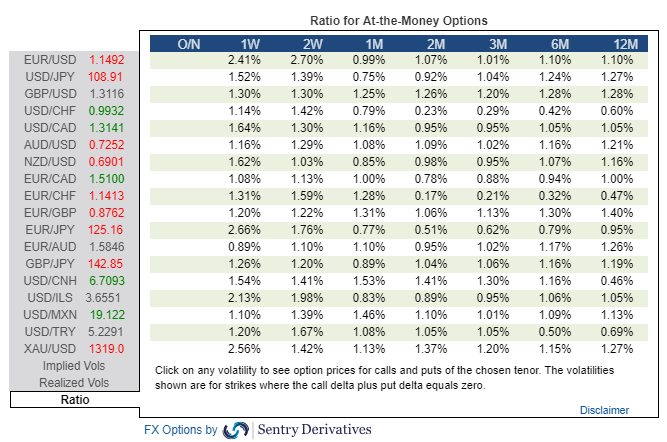
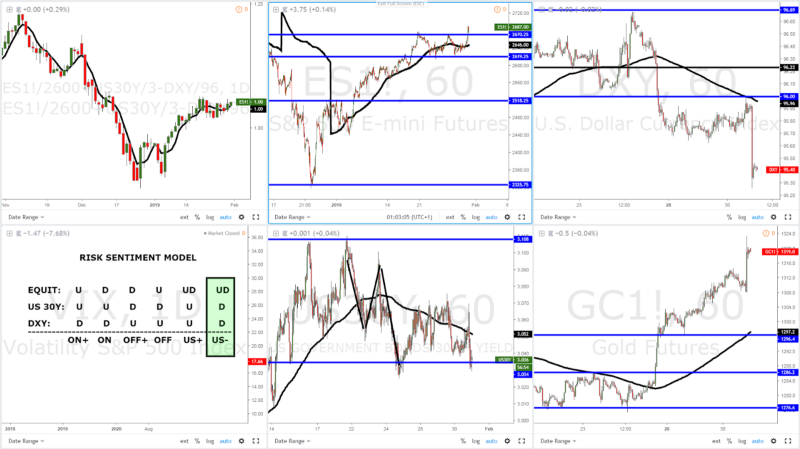
In light of the dovish admissions by the Fed, the U.S. dollar was absolutely smashed across the board as the DXY clearly shows in the chart below. Be mindful, this event has fundamental ramifications one can build upon to stay USD bearish for the near term. If you check the ratios of implied vs historical vols currently at play, we are faced with a market with a directional market profile in nature, which is the best environment for momentum strategies to thrive, when breaks occur. The sellers of puts must hedge their risk by selling breakouts and vice versa, hence limited gamma scalping.
source: Investing. com
Risk assets also thrived in response to the Fed’s message, with the S&P 500 as the bellwether of U.S. equities catching a strong bid, and most importantly, akin to the bearish moves in the USD, found acceptance near the highs of the day. The upbeat in earnings by tech giant Apple (NASDAQ:AAPL) yesterday, alongside the better results by Boeing (NYSE:BA), were underpinning factors for equities right off the bat, with the Fed being the accelerant. The dynamics have now re-anchored to an environment characterized by USD weakness across the board in a context of risk appetite. The 5-DMA slope and cycles both point in the same direction, which means, the safest bet is to swim in the direction of the ‘risk-on’ currents.
source: Tradingview.com
Other measures of risk exhibit an analogous sanguine outlook. For instance, the gold/oil ratio keeps falling as a barometer of positive risk-taking, the VIX is re-visiting the lows of the year around 17.6, global equity markets are moving in tandem with the gains printed in the S&P 500, emerging market currencies, assisted by the collapse in the U.S. dollar, are too finding sufficient strength to keep the bid tone, which will undoubtedly ease the pressure amid mounting USD-denominated debt burdens. Besides, within the EM FX basket, a USD/CNY at 6.7 in a week where high-level talks between the U.S. and a Chinese delegation aimed to reach a compromise on trade is setting a positive stage, even if other issues such as Huawei’s CFO extradition charges, etc, cast a shadow. Keep watching the performance of USD/CNH as the best barometer of where the negotiations are headed.
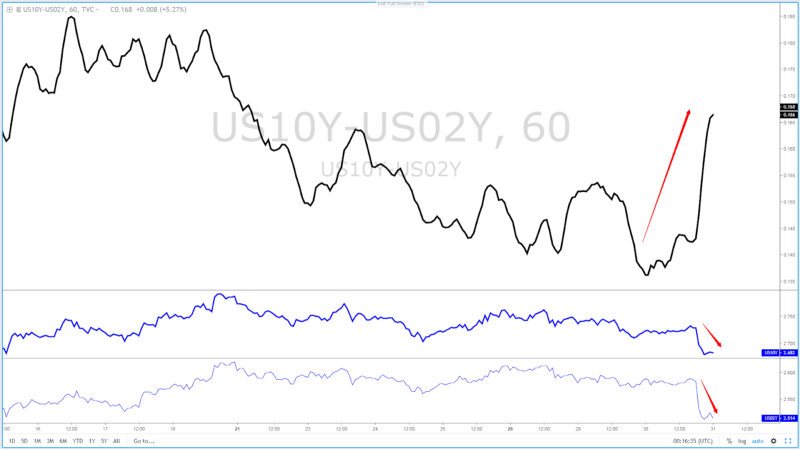
We’ve also entered a bull steepener dynamics in the U.S. yield curve. This is an environment where short-term yields drop faster than long-term yields, and it communicates a potential rate cut down the road as the market factors in diminished expectations for economic growth combined with suppressed inflation. It’s incredible how we’ve transitions so swiftly from a bear steepener, where short-term yields were rising faster than long-term, which suggested the Fed was getting ahead of itself, to now see the Fed finally recognizing past mistakes. Listen to the market.
Source: Tradingview.com
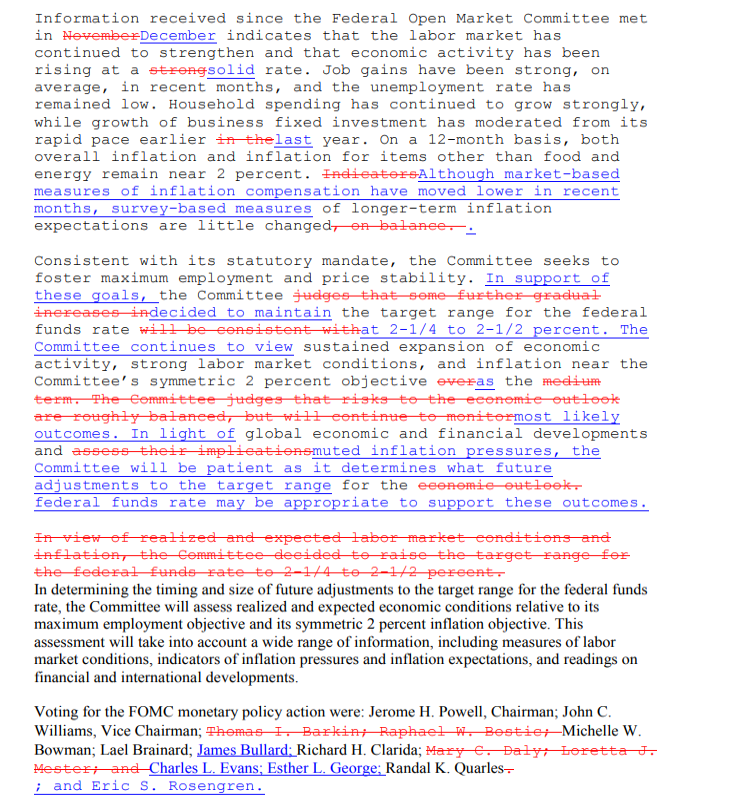
Back to the FOMC statement, as it’s interesting to scope out all the details that have effectively confirmed the 180-degree turnaround in the Fed’s views. First off, the Fed removed its reference to further gradual rate changes from its statement, while the post official speeches noted that the Committee has pledged to be patient on further adjustments to the target range. Even Jerome Powell, on its press conference, gave us the admission that the case for a hike is somewhat weaker.
Source: Forexlive
This is a clear acknowledgment that no rate hikes are expected anytime soon, which could also be understood as a tweak that prepares the market for any eventuality, including a rate cut, as the bull steepener in the chart above harbingers. So, what has led the Fed to turn more prudent on its outlook? By now it should be a no-brainer that it was the tightening of financial conditions from Q4 ’18, which again, was reflected by the statement noting “global economic and financial developments and muted inflationary pressures”. If history is any indication, in the last 30y, every prolonged pause in a Fed rate hike cycle has led to an eventual easing campaign to combat recessions. Interestingly, which is a testament to the structurally weakening trend, every hiking cycle has reached a peak that was lower than the previous tightening campaign’s peak.
The Fed, however, still sees a silver lining beyond the gloomier outlook by the state of the U.S. economy, noting that it “continues to view sustained expansion of economic activity, strong labor market conditions, and inflation near the Committee’s symmetric 2% objective.” On his speech, Powell delivered a mixed-bag outlook by noting “there is growing evidence of cross-currents and patiently waiting for greater clarity has served policymakers well in the past.” The market is now discounting a Fed’s policy structure where no more hikes are expected through 2019.
But make no mistake, the above was just a reiteration of a familiar theme well discounted by the rise in risk assets, what really moved the needle was the acknowledgment that the Committee is “prepared to adjust” the details of its balance sheet normalization if the pre-conditions are present. There was a passage in the statement that clearly strengthens the notion that this has now become a clear possibility going forward, by noting that “the Committee is revising its earlier guidance regarding the conditions under which it could adjust the details of its balance sheet normalization program.” Whenever this happens, it’s going to be a game changer as what was so feared, that is, the continuation of the liquidity drainage via QT, will come to an abrupt halt, which is a very bullish risk event for risk.
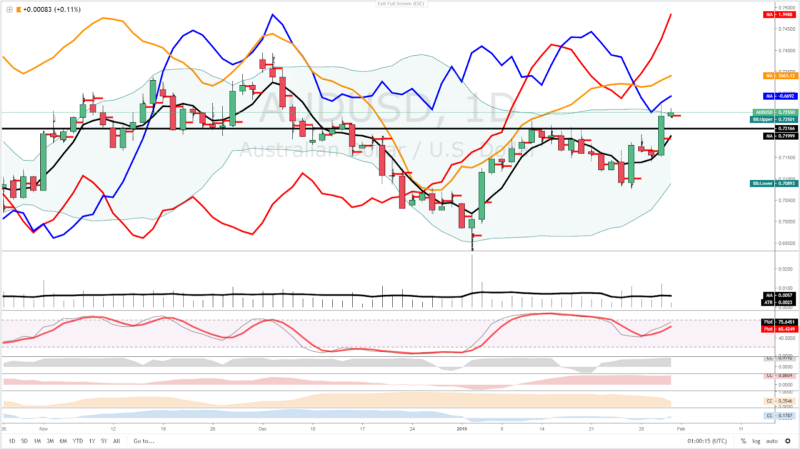
One of the currencies that benefited the most by the sell-off in the U.S. dollar was the Aussie, emboldened not only by a stronger-than-expected CPI reading, but also by a massive nearly 10% outlier rise in Iron ore, coupled with the convergence of global equities higher and a strong Yuan. The Aussie is setting up to experience heightened vol above its historical standards near term. On one hand, vol emanating from the US-China trade negotiations this week will be key. But equally important is the update in monetary policies by the RBA when they meet next week after its holiday period. The clear negative feedback loop into the real Aussie economy from lower house prices has become more evident, which means the chances of a rate cut have gone up heading into Q2/Q3 ’19. The market is pricing over 70% chances of a cut in the next 12 months, which makes you wonder to what extent the market can justify further rises in the currency in anticipation of a potential Central Bank monetary policy divergence play in coming months. We’ll get more clarity next week.
Source: Tradingview.com
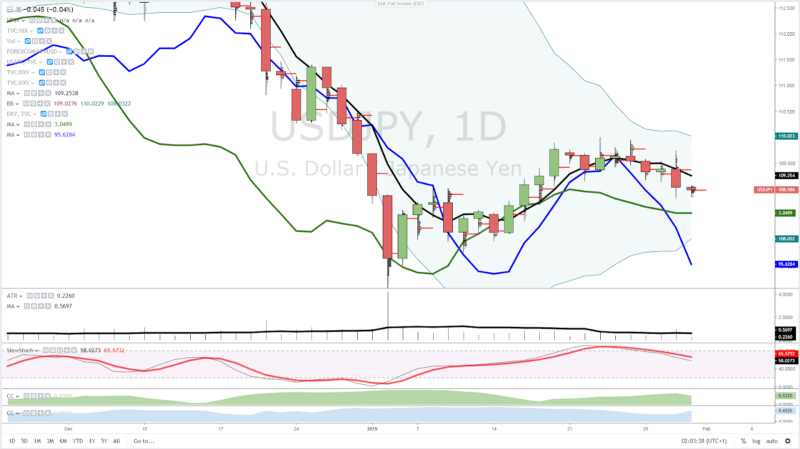
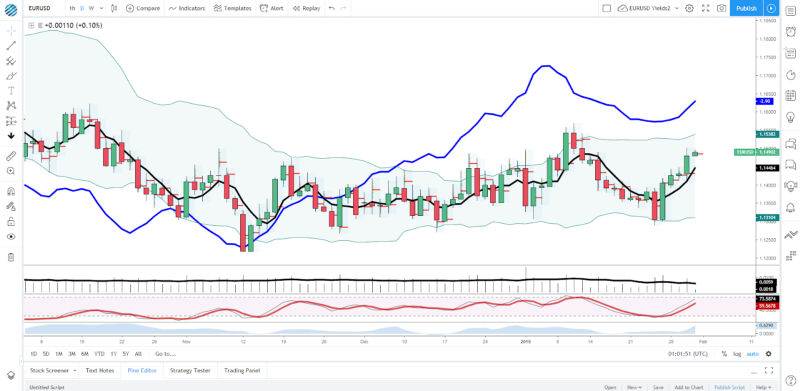
The bullish outside days printed by volume-rich currencies such as EUR or the JPY against the USD is further testament of the market intentions to extend the weakness in the latter. If we pay close attention, the pairs gather all the technical evidence one can possible get to join the momentum, from solid closes by NY cut out time, POCs trapped behind, moves not yet over-extended judging by the slow stochastics, the slope of the 5-DMA in favour, correlations pointing in the same direction. The one discussion that EUR bulls won’t probably come up victorious is the fundamental state of the European economy. The downgrade by the German economy ministry of its growth forecast for 2019 by a whopping 0.8% from 1.8% to 1% is a very gloomy prognosis of the turbulent waters ahead.
Source: Tradingview.com
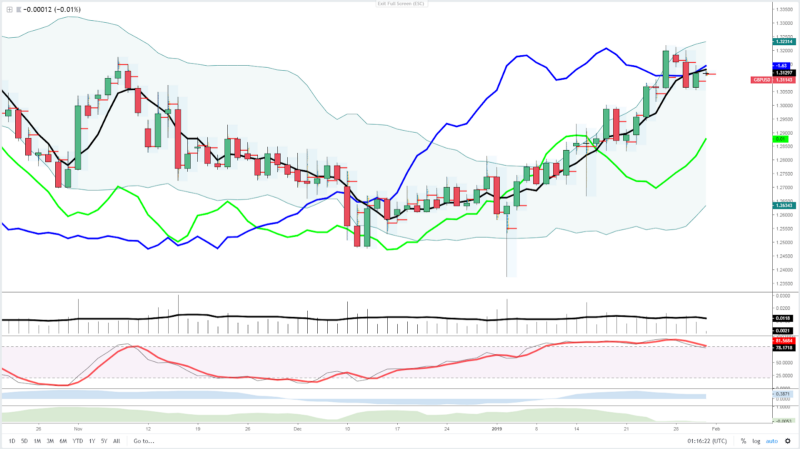
The Sterling was the exception, lagging behind in terms of demand relative to the rest of peers. Where we stand right now in the Brexit mess, after the amendments votes this week, is as complicated as it ever was, as the EC is not backing off from its hard-line stance on the Irish backstop and that a deal will not be re-negotiated, even if it has become clearer that U.K. politicians won’t allow a ‘Hard Brexit’, which makes the prospects of an Article 50 extension not a distant possibility. In terms of price action, even if Tuesday’s commanding bearish bar may trump traders’ confidence to join the trend, similar to the rest of FX, the technical outlook remains sanguine, with correlation in alignment.
Source: Tradingview.com
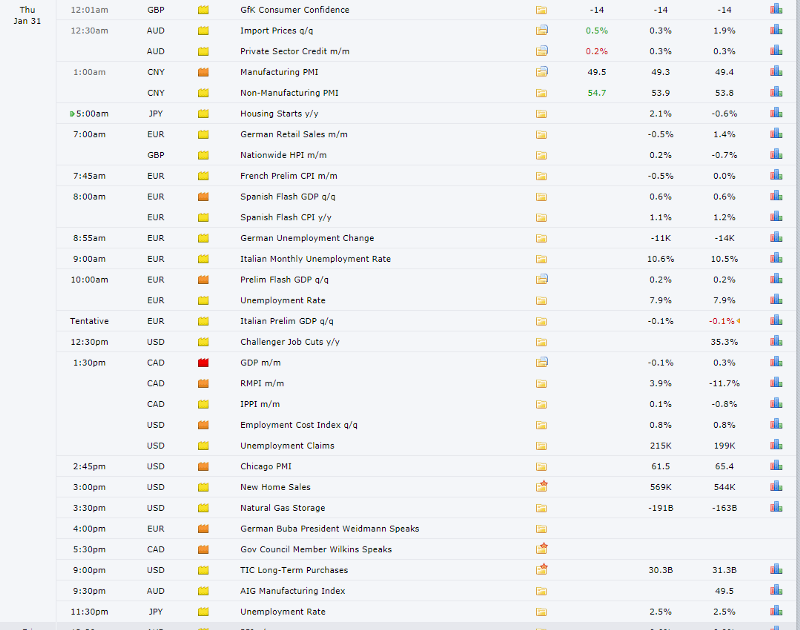
Risk Events/ Economic Heatmap
Source: Forexfactory
Important Footnotes
- Risk model: The fact that financial markets have become so intertwined and dynamic makes it essential to stay constantly in tune with market conditions and adapt to new environments. This prop model will assist you to gauge the context that you are trading so that you can significantly reduce the downside risks. To understand the principles applied in the assessment of this model, refer to the tutorial How to Unpack Risk Sentiment Profiles
- Cycles: Markets evolve in cycles followed by a period of distribution and/or accumulation. The weekly cycles are highlighted in red, blue refers to the daily, while the black lines represent the hourly cycles. To understand the principles applied in the assessment of cycles, refer to the tutorial How To Read Market Structures In Forex
- POC: It refers to the point of control. It represents the areas of most interest by trading volume and should act as walls of bids/offers that may result in price reversals. The volume profile analysis tracks trading activity over a specified time period at specified price levels. The study reveals the constant evolution of the market auction process. If you wish to find out more about the importance of the POC, refer to the tutorial How to Read Volume Profile Structures
- Tick Volume: Price updates activity provides great insights into the actual buy or sell-side commitment to be engaged into a specific directional movement. Studies validate that price updates (tick volume) are highly correlated to actual traded volume, with the correlation being very high, when looking at hourly data. If you wish to find out more about the importance tick volume, refer to the tutorial on Why Is Tick Volume Important To Monitor?
- Horizontal Support/Resistance: Unlike levels of dynamic support or resistance or more subjective measurements such as fibonacci retracements, pivot points, trendlines, or other forms of reactive areas, the horizontal lines of support and resistance are universal concepts used by the majority of market participants. It, therefore, makes the areas the most widely followed and relevant to monitor. The Ultimate Guide To Identify Areas Of High Interest In Any Market
- Trendlines: Besides the horizontal lines, trendlines are helpful as a visual representation of the trend. The trendlines are drawn respecting a series of rules that determine the validation of a new cycle being created. Therefore, these trendline drawn in the chart hinge to a certain interpretation of market structures.
- Correlations: Each forex pair has a series of highly correlated assets to assess valuations. This type of study is called inter-market analysis and it involves scoping out anomalies in the ever-evolving global interconnectivity between equities, bonds, currencies, and commodities. If you would like to understand more about this concept, refer to the tutorial How Divergence In Correlated Assets Can Help You Add An Edge.
- Fundamentals: It’s important to highlight that the daily market outlook provided in this report is subject to the impact of the fundamental news. Any unexpected news may cause the price to behave erratically in the short term.
- Projection Targets: The usefulness of the 100% projection resides in the symmetry and harmonic relationships of market cycles. By drawing a 100% projection, you can anticipate the area in the chart where some type of pause and potential reversals in price is likely to occur, due to 1. The side in control of the cycle takes profits 2. Counter-trend positions are added by contrarian players 3. These are price points where limit orders are set by market-makers. You can find out more by reading the tutorial on The Magical 100% Fibonacci Projection

