Stocks dropped on August 19, giving back their early morning gains after the FOMC minutes. The market seemed to reverse on news from the minutes that the Fed would not introduce yield curve control anytime soon. Given the move higher in yields and the dollar, that is my interpretation. If the move lower in stocks had come on a gloomy outlook as some have suggested, the dollar and yields should have dropped.
Yield curve control would have been what I would have considered infinite forms of QE, as the Fed would have to create massive sums of money to defend rates and keep them pegged, ask the BOJ about that. It would have made the recent move higher in the balance sheet look like pocket change. If the stock market’s recent rise was in hopes of more money printing from yield curve control, those hopes got killed. The Fed is holding the current course steady, which is dovish, but it is merely not dovish enough to support these prices and these valuations. Now, the question is if the equity market will turn its attention to fiscal policy?
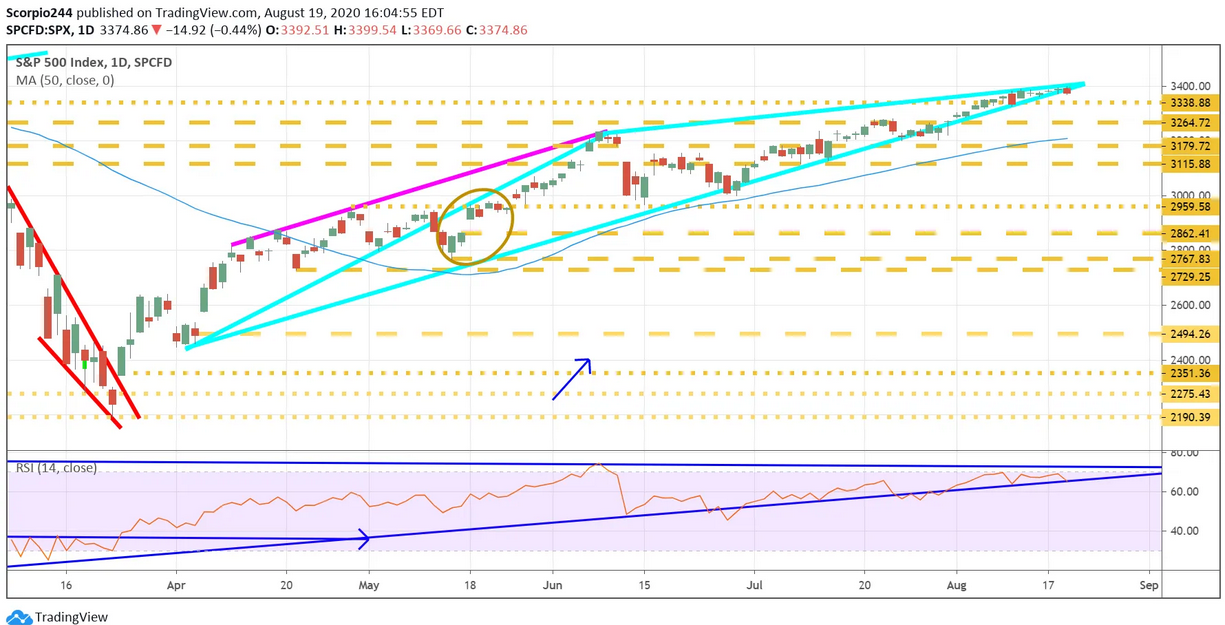
As a result, you saw stocks reverse lower with the S&P 500 falling by much as 85 basis points. The dollar reversed higher, soaring to 93, while 10-year yields climbed back to 68 bps.
S&P 500
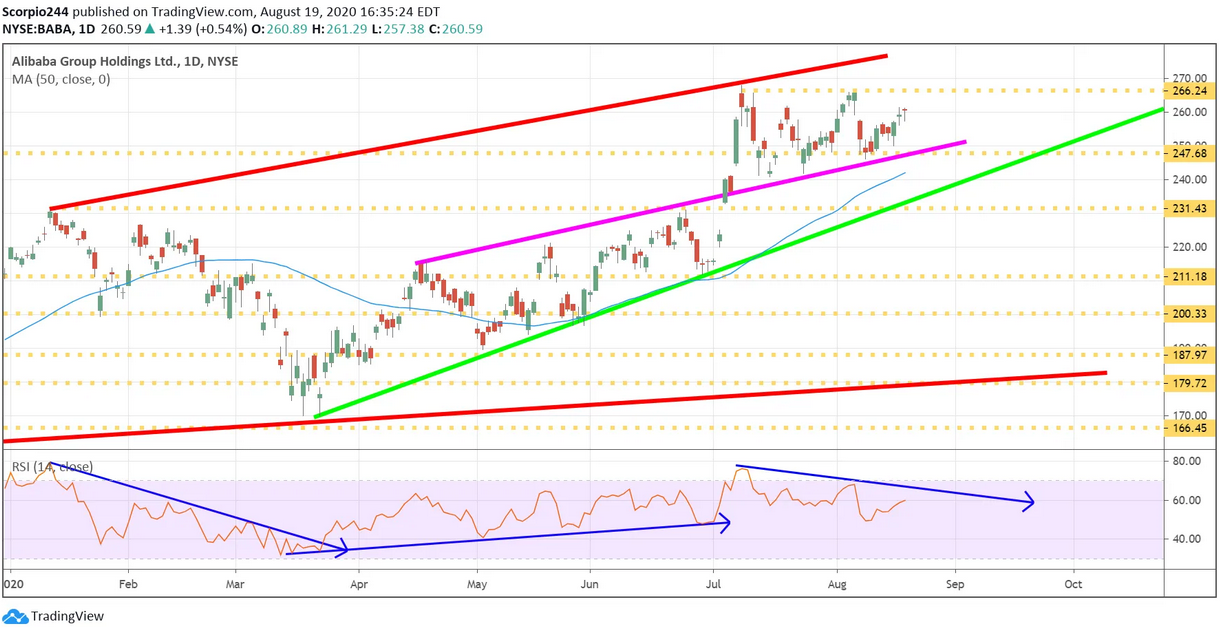
As a result, the S&P 500 just narrowly closed below the uptrend that we have been tracking and has been in place since early April. It is not enough to say the trend is broken, but if you get a down day today, and it is meaningful enough, we could say the trend has broken, that would not be good.
Dollar
Meanwhile, the dollar moved up, and a jump above 94, pushes the dollar to as high as 96.
Gold
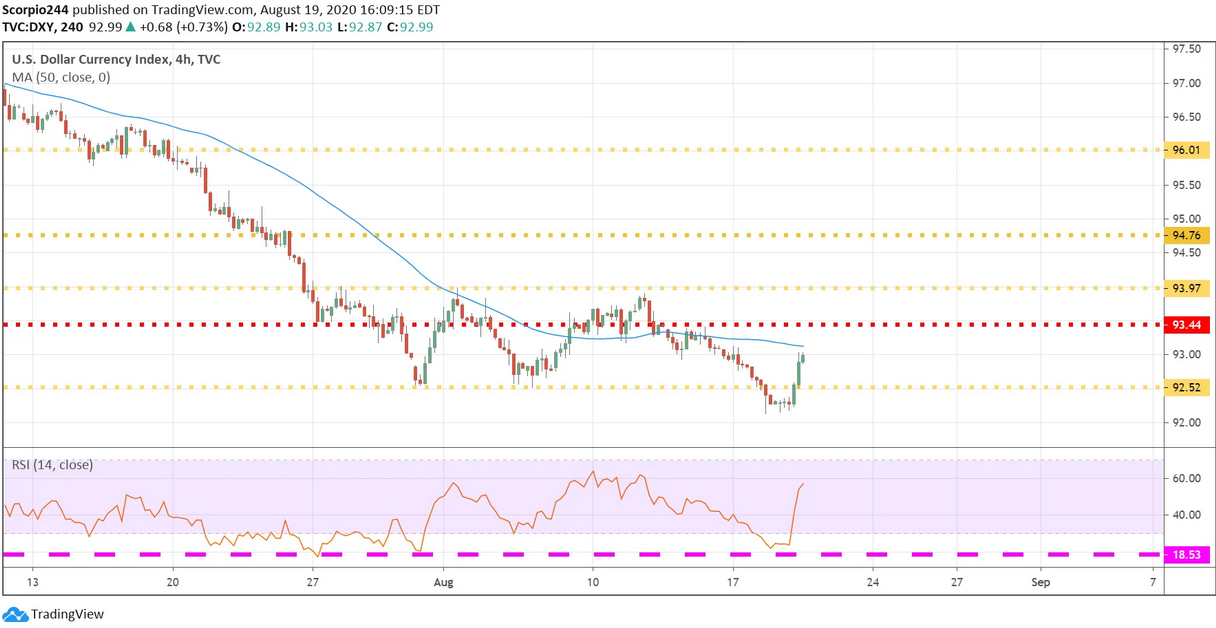
That sent gold prices sharply lower, and with the Fed again warning that the risk to the economy is disinflation, coupled with a dollar moving higher, I don’t see how gold can continue to rise. A break of support at $1,925 sets up a drop to $1,880 and then $1,790.
Netflix
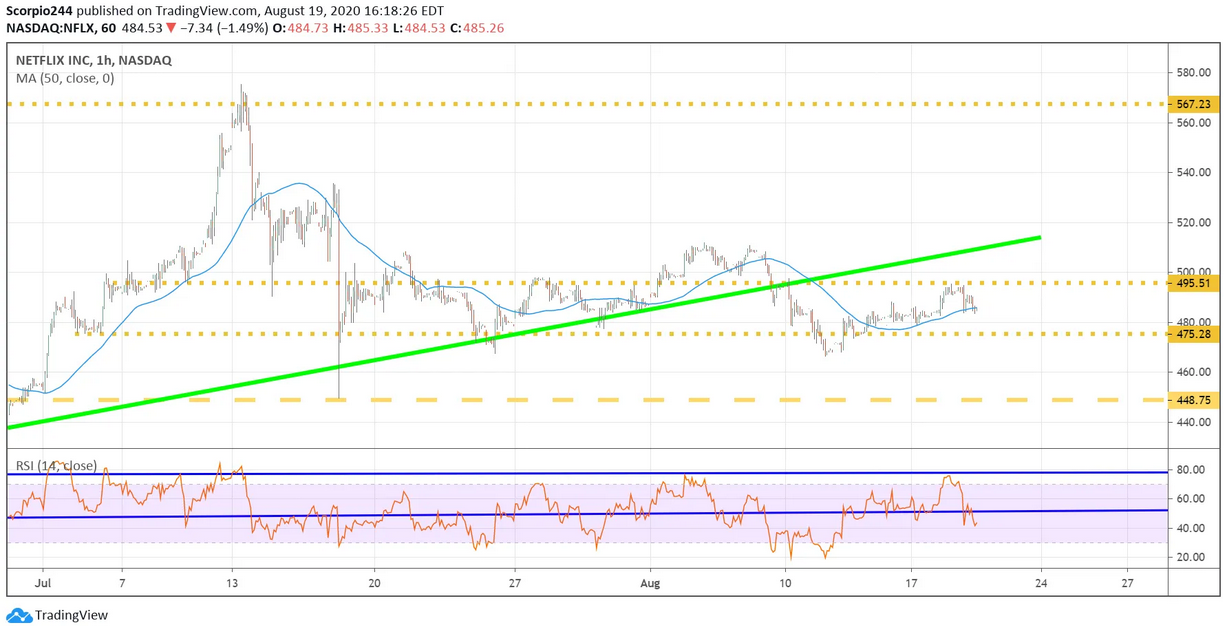
Netflix (NASDAQ:NFLX) climbed too and tested the $495 level and failed to break to the upside. It probably sets up that retest to $475 and potentially to $448.
NVIDIA
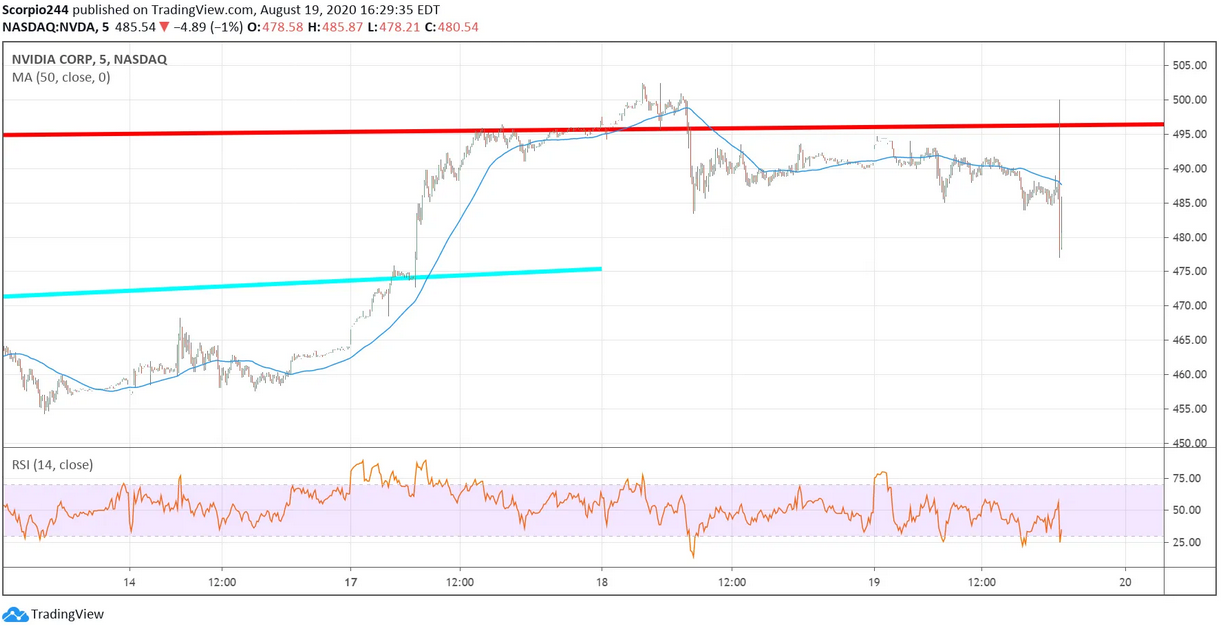
NVIDIA (NASDAQ:NVDA) delivered better than expected results and gave reliable guidance after the bell. The stock is down just a little bit, certainly nothing to cry over. I don’t think the results are good enough to send the stock even higher, and I’m not sure they are going to send the shares lower. Perhaps the commentary on the call will give some more color.
Amazon
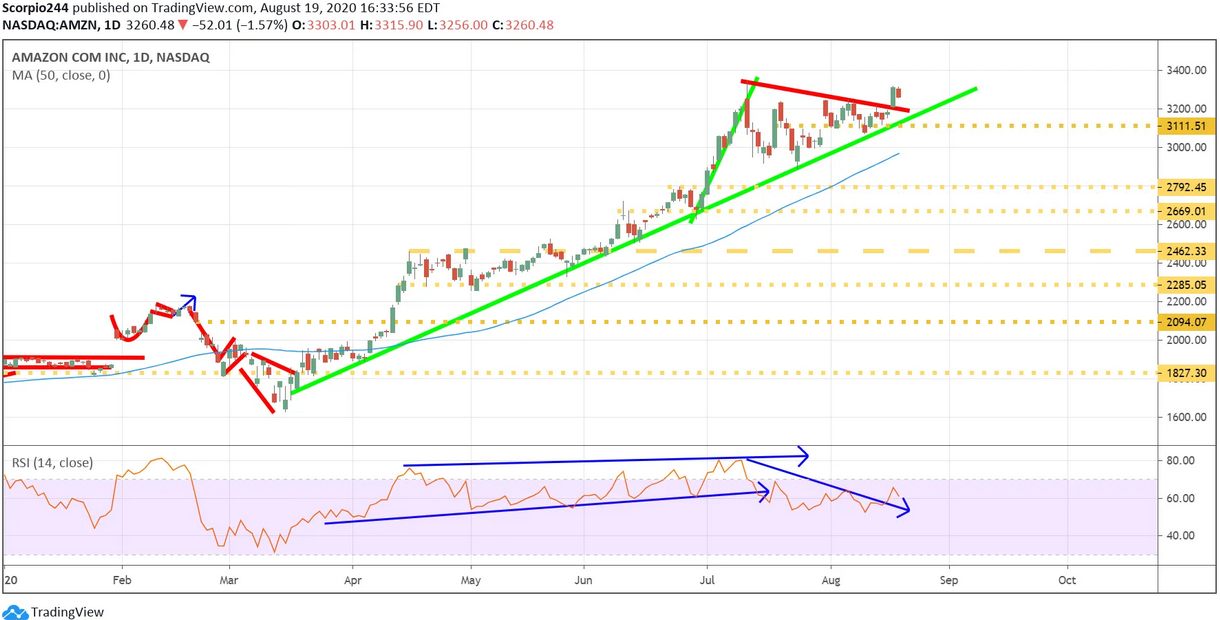
Amazon (NASDAQ:AMZN) moved higher, and above the downtrend, I drew in. I don’t know any more about this stock. What matters is that significant uptrend that has been in place since the middle of March, as long as that holds the stock goes higher. The RSI still points lower, but we can deal with that another time.
Alibaba
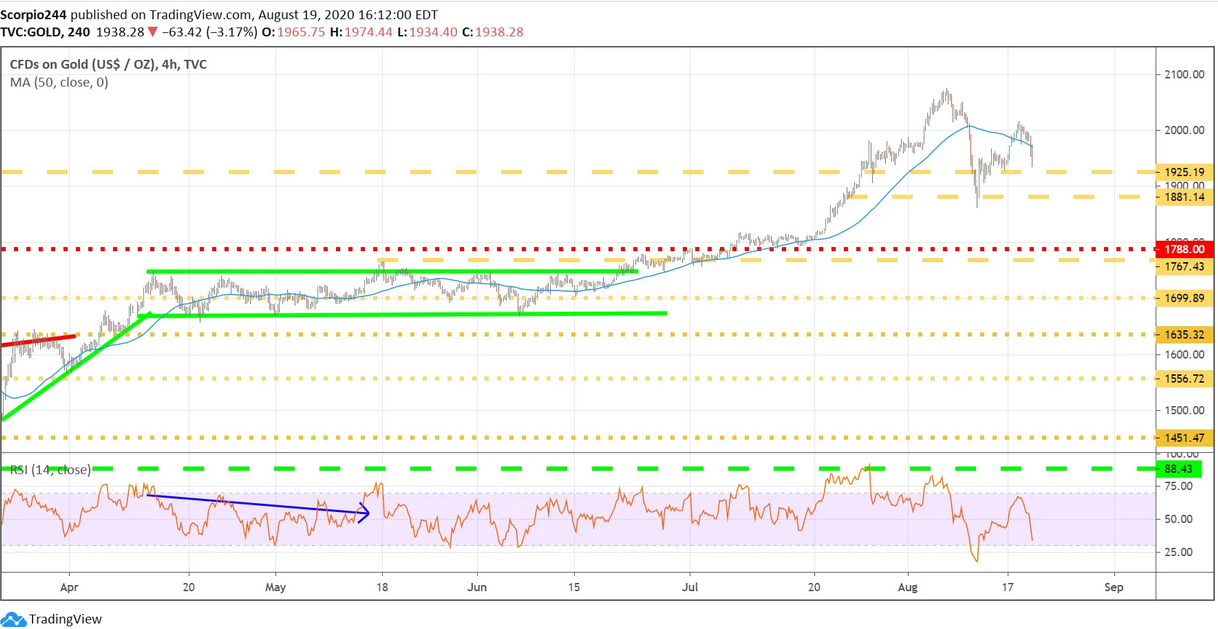
Finally, I saw some bearish betting yesterday in Alibaba (NYSE:BABA), and it indicates the stock is likely to fall in the coming in the weeks. Perhaps today’s results trigger that break down.
