Summary: The Fed may soon cut rates and that prospect is making investors nervous. Is the start of easing necessarily bad for equities? In short, probably not, at least not immediately. There's more to it than that.
Equities have most often risen after the first rate cut. The only times when equities have consistently traded lower was when they were already doing poorly.
Moreover, the economic data had already been persistently weak for many months (even years) prior to the times when the first rate cut was followed by a recession and an equity bear market. That's not at all the case this time, making it similar to years like 1984, 1995 and 1998 when rate cuts were subsequently reversed with further rate hikes.
There are never any guarantees but it's probably different this time, in a good way.
The Fed is now expected to cut its overnight rate 3 times in the next year (from Jim Bianco).
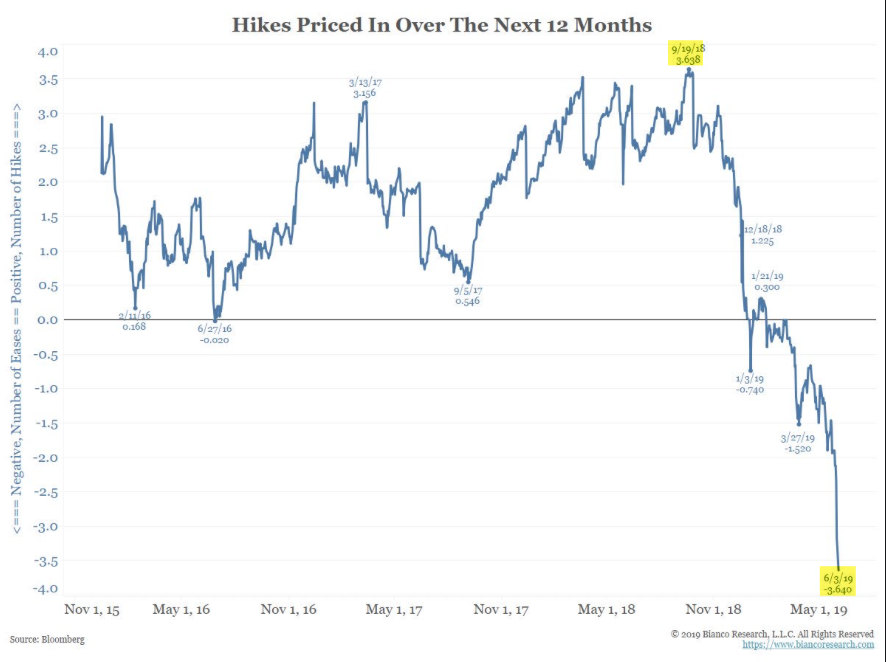
It's probably worth taking those 3 rate cuts with a tablespoon of salt. Look again at the chart above: just 5 months ago, expectations were for at least one rate hike in the next year, and last September the expectation was for more than 3 hikes. Things have swung wildly in the other direction and they may well do so again.
Investors are viewing this as the end for stocks. This is ironic because many have spent the past 3-1/2 years, when rates were being increased, fearing that the Fed would choke the recovery just as it was getting going. They now fear the exact opposite. Apparently, any action the Fed takes should be assumed to be the end for stocks.
More to the point, is the start of easing necessarily bad for equities? In short, probably not, at least not immediately. There's more to it than that.
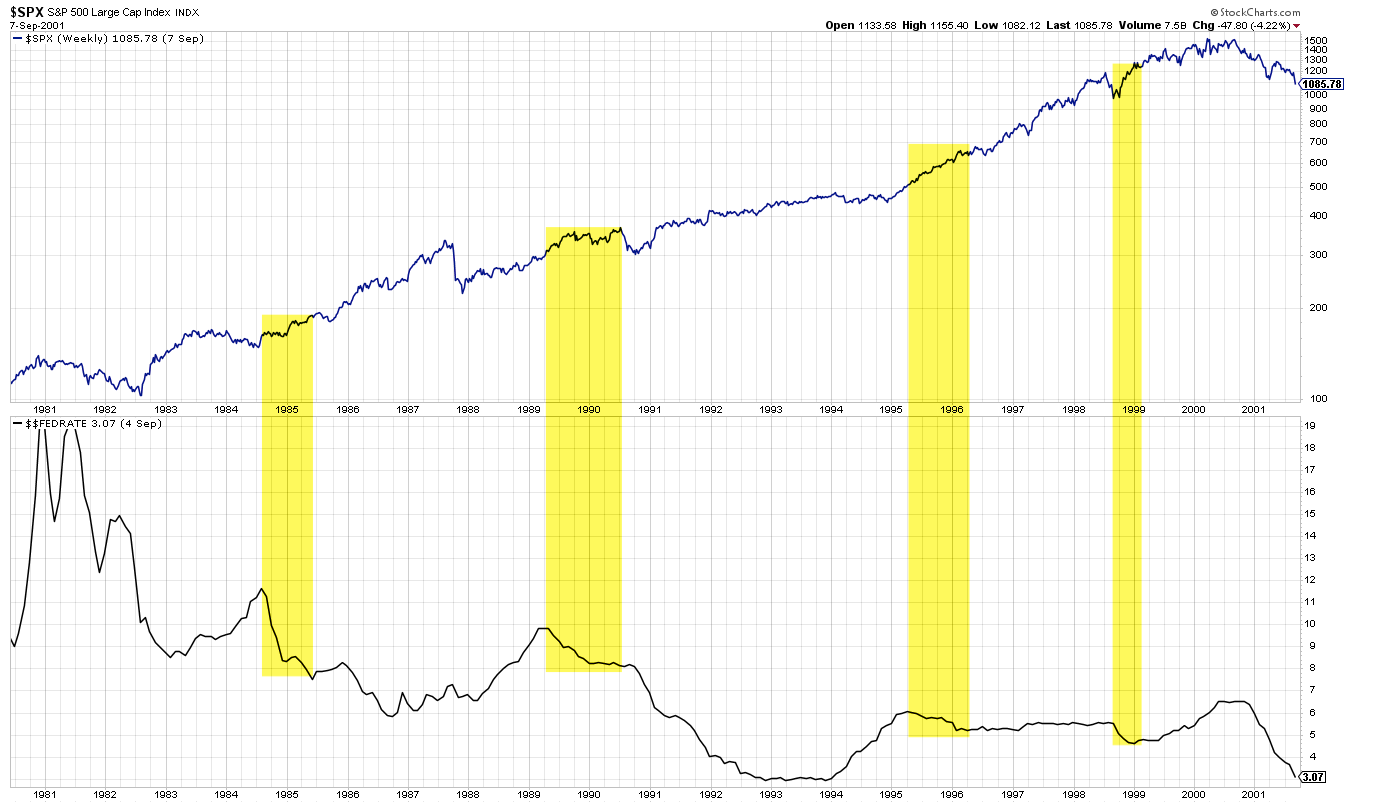
True, Fed rates were cut starting in January 2001 and September 2007 and the S&P 500 was 30-50% lower within about a year both times. This is why investors are now fearful of a rate cut.
But the Fed started to cut rates in 1984, 1989, 1995 and 1998, too (lower panel). And within 6 months, SPX was at least 7% higher each time (upper panel). In fact, the bull market continued for at least another year and often for several more years after the first rate cut. It was nowhere near the end.
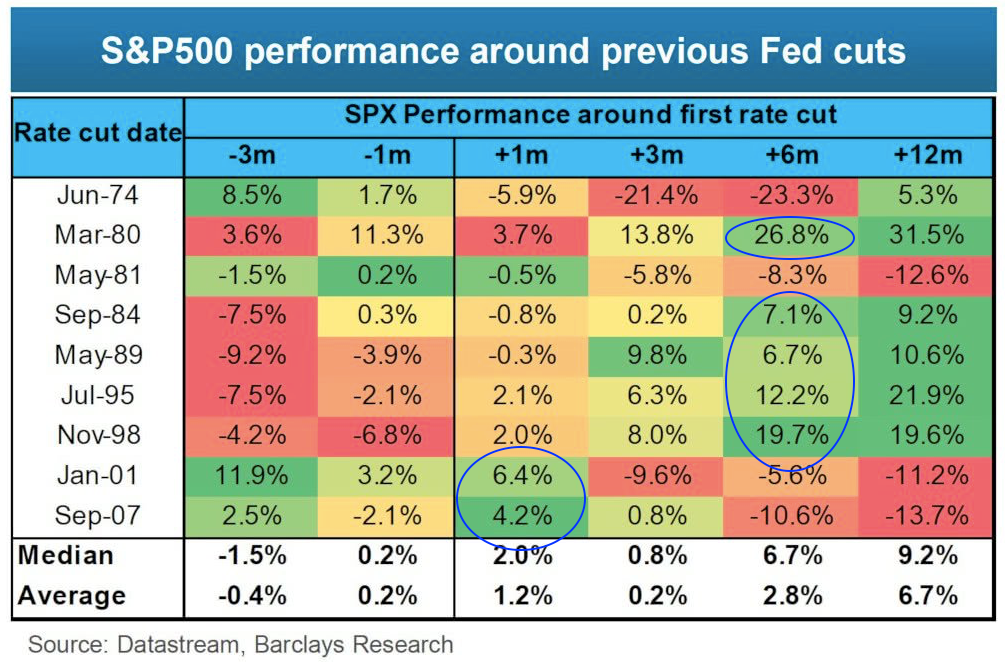
That's true more generally. A month after the September 2007 rate cut, SPX rose nearly 7% and made a new all-time high.
The last time the first rate cut led to consistently lower stock prices (and SPX wasn't already well on its way to a bear market) was nearly 40 years ago: the May 1981 rate cut came a half year after SPX had peaked and was barely out of a recession that had begun 17 months earlier. The 1974 rate cut came 7 months into a recession and a year and half after the peak in SPX. The 2001 rate cut came 9 months after the peak in SPX when it was already down 15% and well on its way to a bear market. It's different this time, in a good way (from Isabelnet).
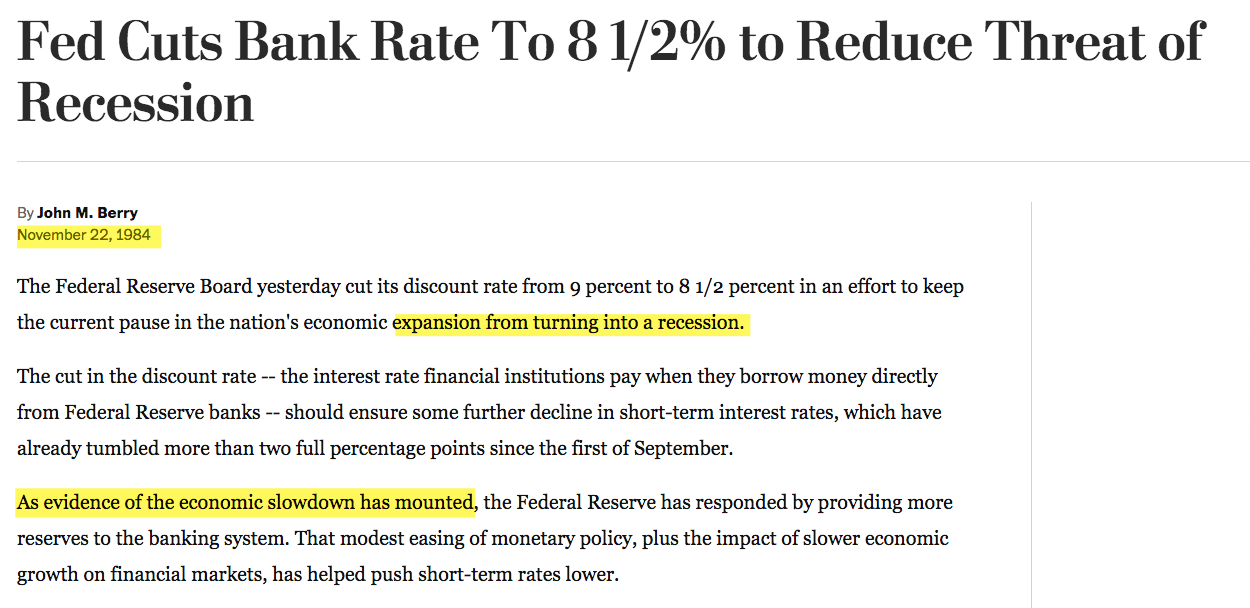
"Hindsight bias" makes you believe there were no really serious economic threats during prior rate cuts in the 1980s and 1990s, because you know the outcome (stocks rose by a lot). But that was not true in real time. Each time, investors and economists feared an oncoming recession that was eventually avoided (maybe because of the Fed!). Our current situation might be no different (from WSJ, NYT and CNN, respectively).
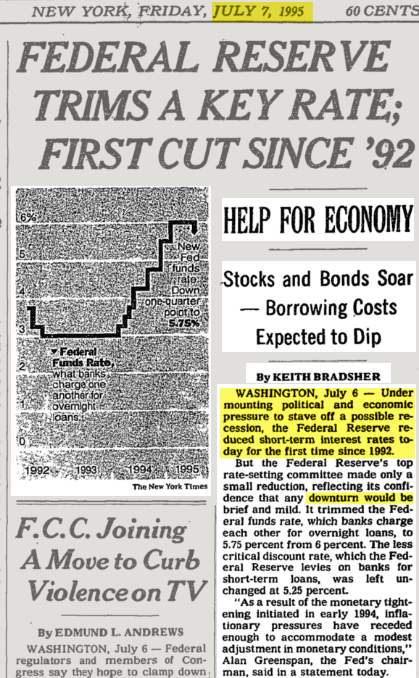
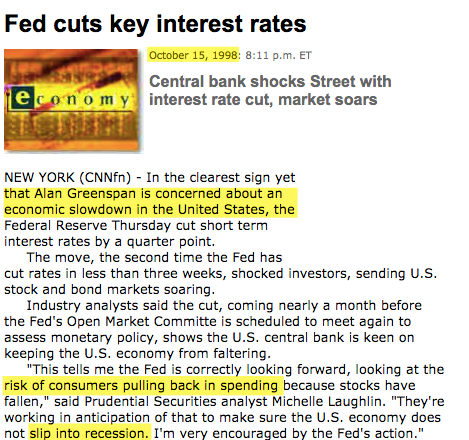
Leave aside the rate cuts that started in 1984, 1995 and 1998, all of which were eventually reversed before the expansion ended. The current economic data is much stronger than that prior to the first rate cut in all the examples above over the past 45 years that were followed by a recession and a bear market.
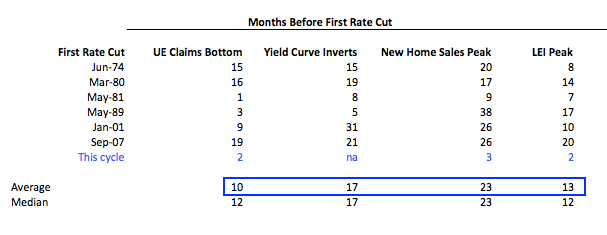
Assume that rates are cut later this month. It would be just 2 months after a 50 year low in unemployment claims, 3 months after a cycle high in new home sales, 2 months after a peak in the Leading Economic Indicator and before the 10-2 yield curve has even inverted (which would be a first). The average for all of these in prior cycles is between 10 months and two years before the first rate cut.
In other words, the economic data had already been persistently weak. Not so this time, making it similar to those other dates (1984, 1995 and 1998) where rate cuts were subsequently reversed with further rate hikes (in November 1984, March 1997 and June 1999).
Equities have most often risen after the first rate cut. The only times when equities have consistently traded lower was when they were already doing poorly. Moreover, the economic data now are relatively strong. There are never any guarantees but it's probably different this time, in a good way.
