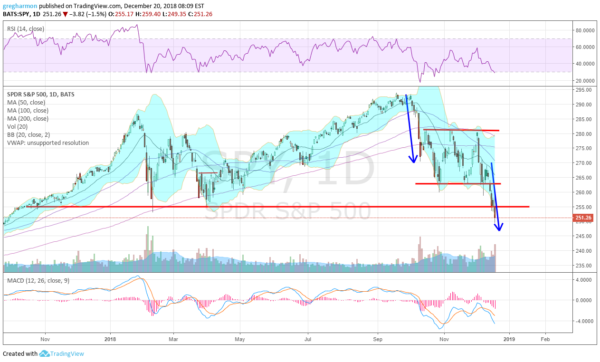
When the S&P 500 started to move lower from a top at the end of September it was a blip at first. A retest of the January high perhaps. That though was quickly erased as the index dropped to and through its 200 day SMA in just over a week. That initial thrust is shown s the blue arrow on the left in the chart below.

Two months of consolidation in a channel followed. It came with lower lows, near a retest of the February low, but not quite there. It also had moments where the Index looked to be ready to reverse course and head higher. Those all failed at the 100 day SMA and it reversed.
This week the ECB had their taper moment, and the FOMC disappointed by following through with a widely telegraphed rate hike despite lowering their forward rate expectations. The reaction in the S&P 500 was not pleasant. The drop Put the Index at new 52 week lows and the farthest below its 200 day SMA that it has been since the Great recession. And even simple technical patterns suggest the bottom is not in yet.
A simple Measured Move out of the consolidation equal to the move into it would put the Index ETF at about 247. Support areas below that show up at 243 and 240, but they may or may not matter. Sentiment is driving market prices now. And sentiment can overwhelm anything. Protection mode remains.
The information in this blog post represents my own opinions and does not contain a recommendation for any particular security or investment. I or my affiliates may hold positions or other interests in securities mentioned in the Blog, please see my Disclaimer page for my full disclaimer.
