💎 Fed’s first rate cut since 2020 set to trigger market. Find undervalued gems with Fair ValueSee Undervalued Stocks

Stock Market Volatility's Extraordinary Plunge

Published 11/27/2017, 06:30 AM
Updated 07/09/2023, 06:31 AM
US500
-

Regular readers and followers on social media will be familiar with this chart, but what will probably be surprising is how this alternative gauge of stock market volatility has made the plunge to the lowest level seen since 1966. The crunch-down in S&P 500 volatility is extraordinary, albeit it is a familiar sign as this metric often trends down as a new bull market gets underway – certainly at least in the initial phase.

Just like our analysis on yield curves and the bond market, it is perhaps just another sign of the stage of the market and business cycles. That is, it is a sign of a maturing cycle. Of course the next question is (and should be) when does the cycle turn? The simplest answer is that you will know when it happens.

Rather than being a throwaway line, this refers to the fact that instead of making wild predictions and forecasts, people like us prefer to study the data, the indicators, and let the facts tell us what's happening and what to do. In this respect we are watching precisely this indicator and many others like it, because the easiest way to tell when a market and business cycle is turning, is to simply pay attention.

This alternative view of volatility tracks the rolling annual sum of daily price changes exceeding +/- 1% – in other words, over the last 252 trading days there were only 9 days where price changed by 1% or more.
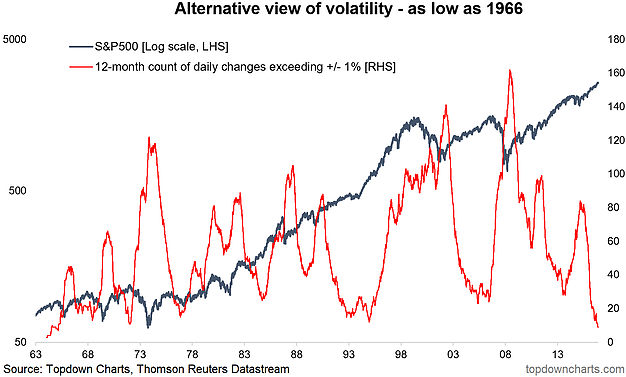
Alternative View Of Volatility

Looking at the tapestry of volatility, whether you set the bar at 1% or 0.5%, it's clear we are in extraordinary times, and the trends are echoed in traditional implied volatility (and implied correlations by the way).
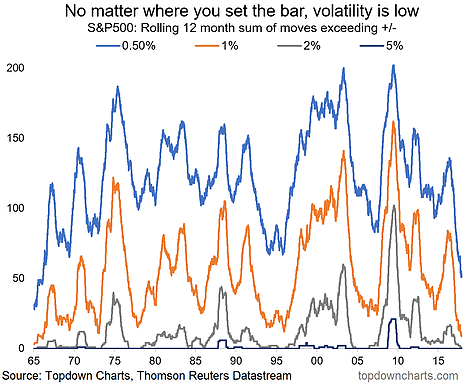
S&P 500 Rolling 12 Month

Latest comments

Loading next article…
Risk Disclosure: Trading in financial instruments and/or cryptocurrencies involves high risks including the risk of losing some, or all, of your investment amount, and may not be suitable for all investors. Prices of cryptocurrencies are extremely volatile and may be affected by external factors such as financial, regulatory or political events. Trading on margin increases the financial risks.
Before deciding to trade in financial instrument or cryptocurrencies you should be fully informed of the risks and costs associated with trading the financial markets, carefully consider your investment objectives, level of experience, and risk appetite, and seek professional advice where needed.
Fusion Media would like to remind you that the data contained in this website is not necessarily real-time nor accurate. The data and prices on the website are not necessarily provided by any market or exchange, but may be provided by market makers, and so prices may not be accurate and may differ from the actual price at any given market, meaning prices are indicative and not appropriate for trading purposes. Fusion Media and any provider of the data contained in this website will not accept liability for any loss or damage as a result of your trading, or your reliance on the information contained within this website.
It is prohibited to use, store, reproduce, display, modify, transmit or distribute the data contained in this website without the explicit prior written permission of Fusion Media and/or the data provider. All intellectual property rights are reserved by the providers and/or the exchange providing the data contained in this website.
Fusion Media may be compensated by the advertisers that appear on the website, based on your interaction with the advertisements or advertisers.
© 2007-2024 - Fusion Media Limited. All Rights Reserved.