Mixed Week As U.S. Stocks Continue To Dip
There was more meandering than trending last week, but in some corners the fading of the bullish sentiment appeared to be gathering strength.
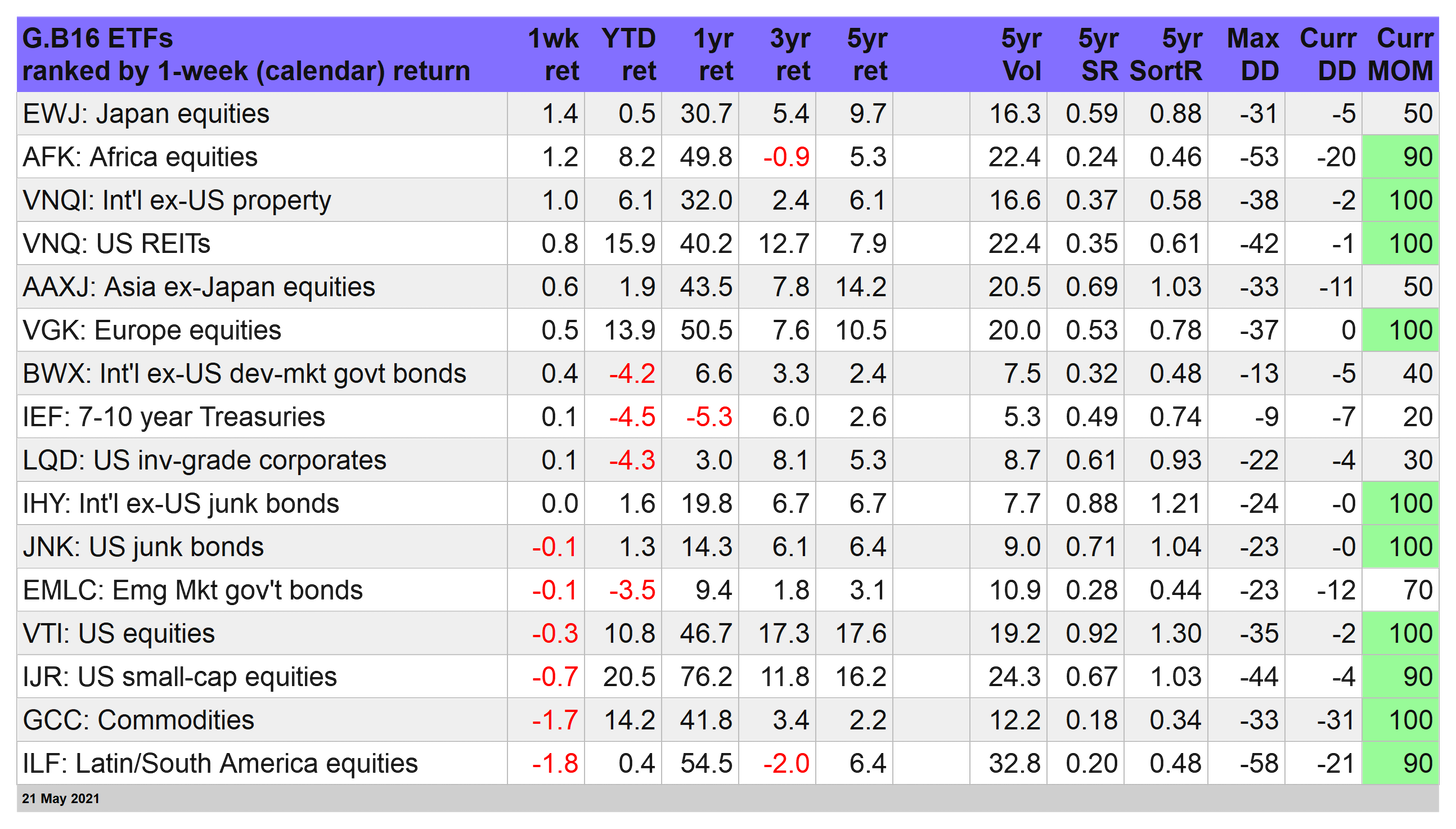
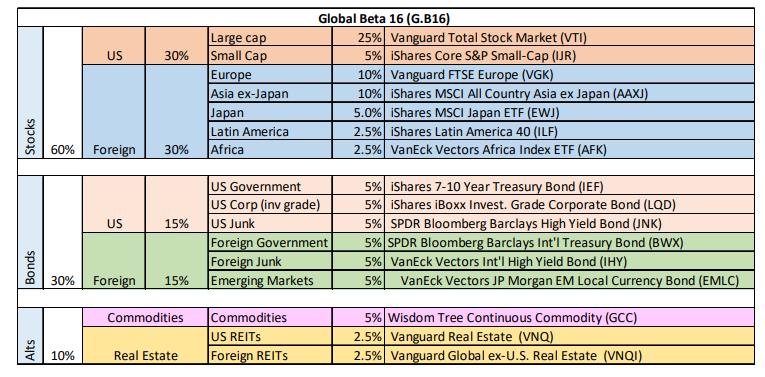
Take the week’s top performer for our global 16-fund opportunity set (a proxy for the world’s major asset classes): equities in Japan.
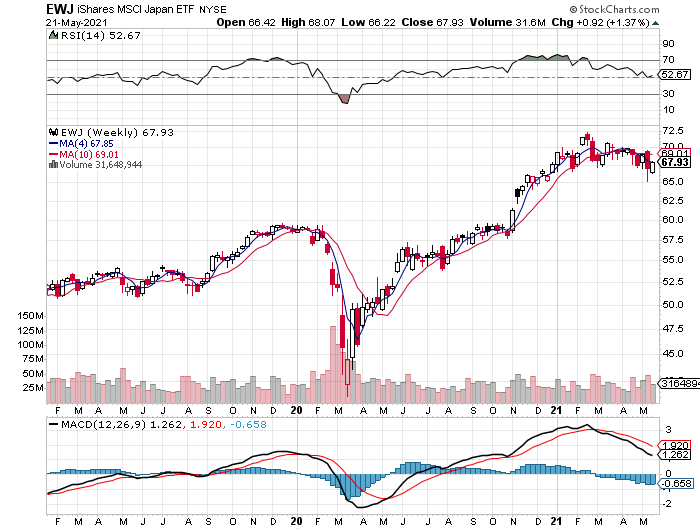
The iShares MSCI Japan ETF (NYSE:EWJ) led the gainers with a 1.4% weekly advance through Friday's close (May 21).
Nice, but the rally didn't look convincing as recent history suggests the fund was rolling over after a potent rally off of last year’s low. Indeed, EWJ’s momentum ranking (MOM column in table above) remained at 50, which was the midway mark between bearish and bullish biases.
Perhaps tipping the scale to the darker side in the weeks ahead was Friday's news via PMI survey data that shows Japan’s economy slipped back into contraction this month. For details on all the strategy rules and risk metrics, see this summary.
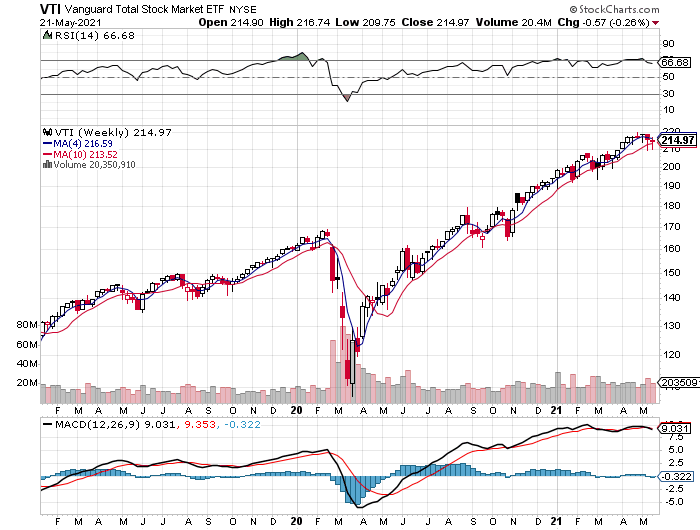
US shares looked firmer, although Vanguard Total Stock Market Index Fund ETF Shares (NYSE:VTI) retreated for a second week, slipping 0.3%.
But in contrast with EWJ, VTI’s MOM score remained at a red-hot 100—the strongest bullish print—and so it’s not yet obvious that American stocks are due for an extended correction.
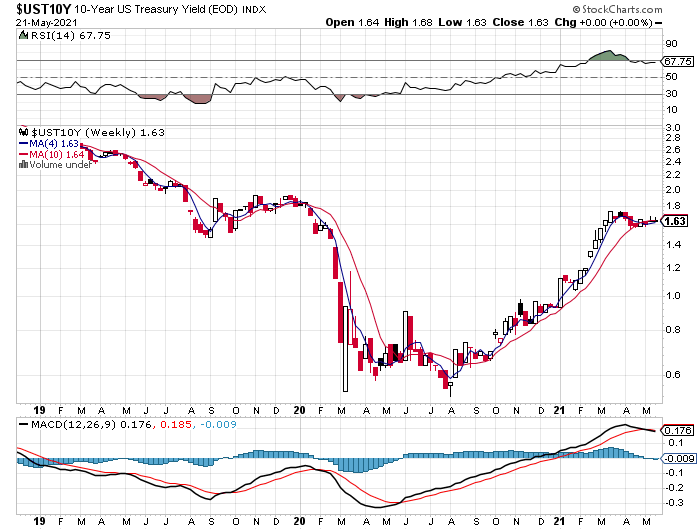
Meanwhile, the 10-year Treasury yield continued to tread water and was unchanged for the week at 1.63%. Inflation may be on track to run hotter, or so we’ve heard. But for now, the bond market’s done pricing in that risk beyond the back-up in rates that’s already baked in.
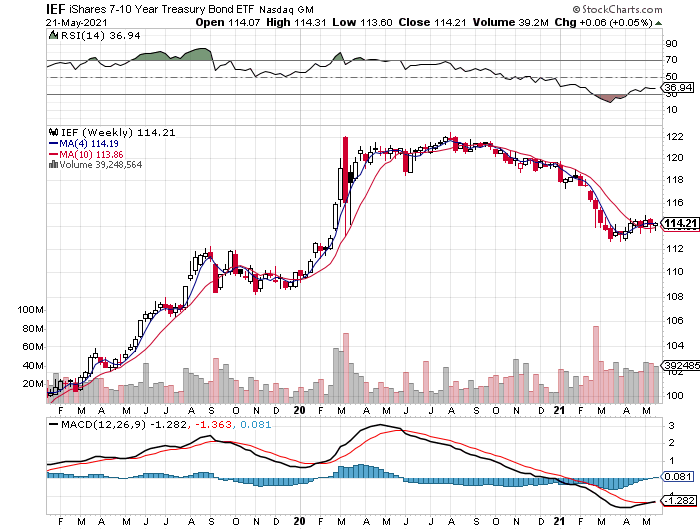
The flatlining for rates translated to similar behavior for iShares 7-10 Year Treasury Bond (NYSE:IEF), which ticked up last week but continued to trade in a tight range.
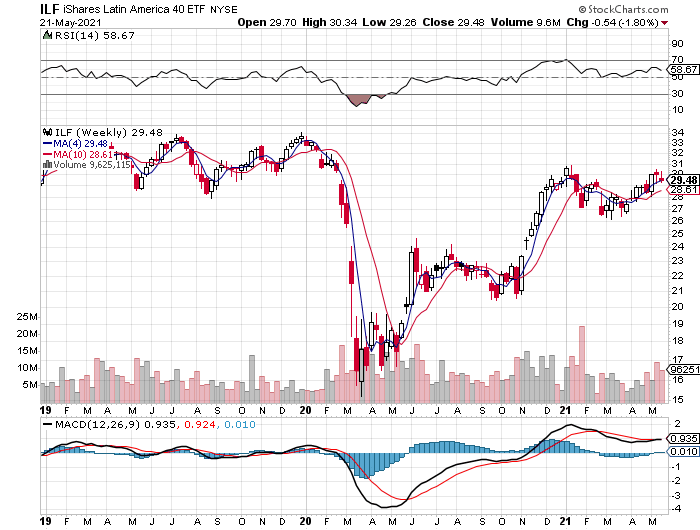
Last week’s biggest decline: iShares Latin America 40 ETF (NYSE:ILF), which fell 1.8%. Despite the setback, the fund still appeared to be trending higher and ILF’s strong 90 score for MOM didn't suggest otherwise.
A Slight Edge For Global Asset Allocation
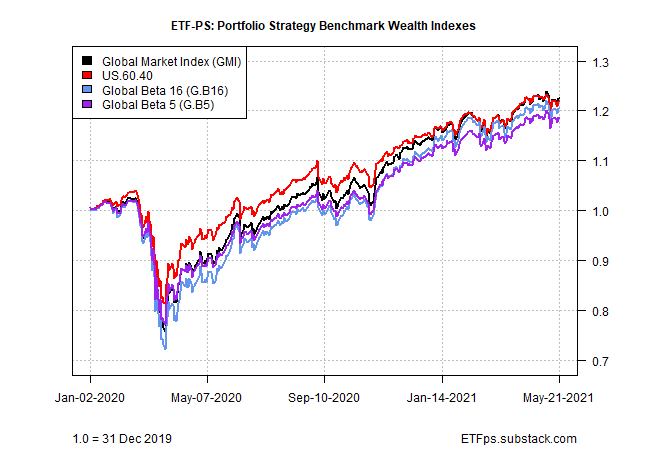
Owning markets far and wide delivered a slight premium last week. Granted, the edge was thin, but perhaps it’s a sign of things to come. In any case, our global benchmark portfolios avoided a loss, which is more than you can say for the standard US 60/40 stock/bond strategy (US.60.40).
For a second week, US.60.40 retreated, albeit gently, posting a slight 0.1% weekly decline.
Meantime, Global Market Index (GMI) and Global Beta 16 (G.B16) were neck and neck with 0.1% gains. Note, however, that G.b16 continued to hold a comfortable lead year-to-date over its competitors via a 7.1% gain.
The 100 MOM scores for all the strategy benchmarks implies that the party’s not over. What might derail the festivities with a surprise shock? Inflation risk is probably at or near the top of the list these days. But the bond market’s calm demeanor of late suggests this is a risk that’s faded a bit as a real and present danger.

