T2108 Status: 36.5%
T2107 Status: 30.0%
VIX Status: 18.1
General (Short-term) Trading Call: neutral
Active T2108 periods: Day #43 over 20%, Day #42 over 30%, Day #1 under 40% (ending 12 dys over 40%) (underperiod), Day #2 below 50%, Day #17 under 60%, Day #357 under 70%
Commentary
In the last T2108 Update I warned that the S&P 500 (N:SPY) experienced a notable setback. The action today, December 3, 2015, delivered definitive follow-through selling.
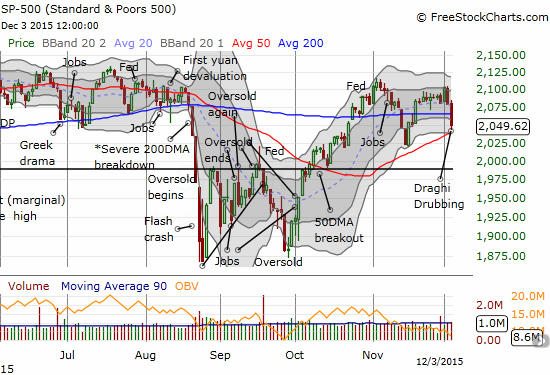
The S&P 500 (SPY) plunges through its 200-DMA again on its way to a retest of 50-DMA support.
Note that my trading call was not predicting the market’s reaction to the news of the day: the latest monetary policy decision from the European Central Bank (ECB). What I will call the Draghi Drubbing (the president of the ECB is Mario Draghi) simply provided a sufficient catalyst to trigger the follow-through selling. Think of the market being primed to throw a tantrum at even the slightest disappointment. The divergence I noted exposed the market’s true underlying weakness.
So now, in just three days, the S&P 500 has gone from a celebratory start featuring a quick 1.1% gain to a 1.5% loss on the month that has traders worried about all the rest of the economic and policy news coming down the pipe this month. However, as I stated in the last T2108 Update, bears cannot get too excited: December is typically a very tame month even in terms of maximum drawdowns. Indeed, T2108 has plunged right back to territory that in recent years has often preceded quick recoveries. The last close below 40% occurred on November 13. The next trading day, the S&P 500 (practically inexplicably) jumped 1.5%. That was the start of the last (short) rally.
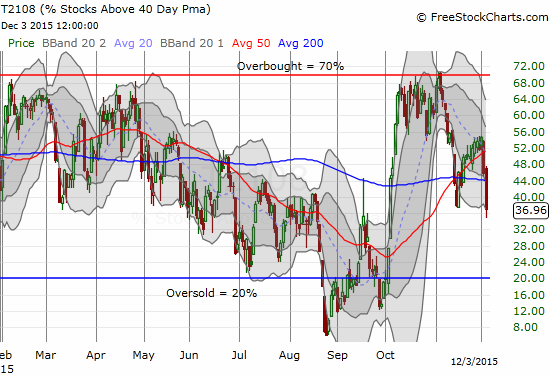
T2108, the percentage of stocks trading above their 40-DMAs, is at a 2-month low.
The next catalyst for the market is the U.S. jobs report for November. Just as the market was primed to react poorly to bad news the previous day, it is now primed to react very well to good news. I honestly have no idea anymore whether a strong jobs report will be interpreted as good or bad by the market at this juncture where a rate hike seems like a done deal. I will be in reaction mode, not prediction mode.
The Volatility Index, the VIX, jumped off its 15.35 pivot. If the market reacts well to the jobs report, fading volatility might be the best trade for the day.
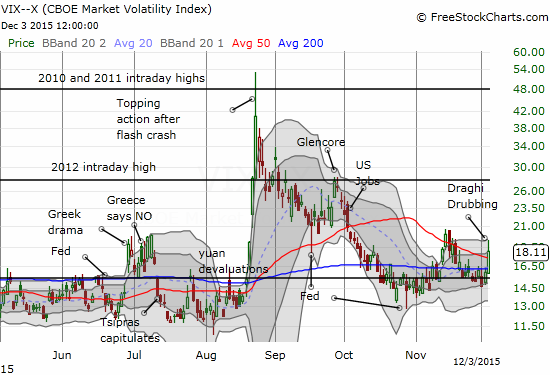
The volatility index gains new life thanks to the Draghi Drubbing
If you still do not believe you have to pay attention to the currency market during tense market moments, THIS day should have cured you of this mistake. Currencies are tempering any bullish expectations I might have otherwise had with T2108 this low (I am keeping the short-term trading call at neutral). The tremendous surge in the euro (N:FXE) likely blew up a lot of carry trades that were helping to fuel stocks higher. Perhaps more importantly, the Australian dollar’s (N:FXA) rally against the Japanese yen (N:FXY) finally came to a screeching halt right at 200-DMA resistance. My favorite forex indicator for stocks could be signaling further downside for stocks.
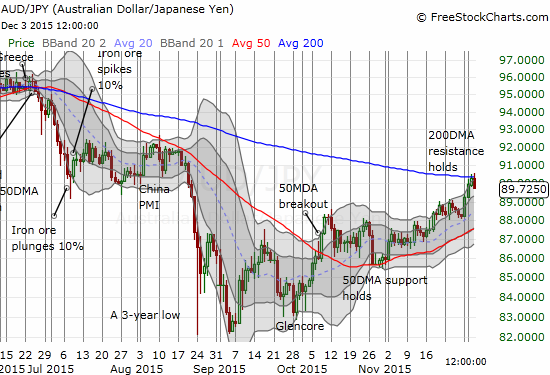
The Australian dollar’s contrarian rally may have finally come to an end as AUD/JPY fails to break through 200-DMA resistance.
Perhaps the big irony of the day is that the U.S. dollar index (DXY0) plunged thanks to the euro and provided the Fed a much easier setup for raising rates. Draghi’s drubbing demonstrated that a straight line to the easier money the market wants and expects no longer exists. Moreover, Janet Yellen testified in Congress on the Fed and monetary policy and once again made it clear that the Fed is more than likely on the way to hiking rates this month. The end result? A euro over-extended above its upper-Bollinger® Band (BB) against a whole host of currencies, a dollar index that managed to erase a month of gains in just one day, a iShares 20+ Year Treasury Bond (N:TLT) that managed to lose a whopping 2.7%, and odds of a December rate hike around their highest level yet.
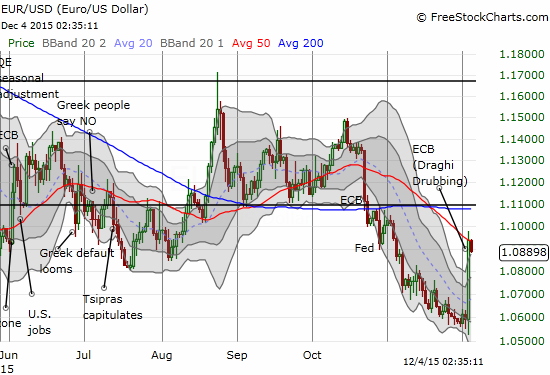
The euro soared against the U.S. dollar from multi-month lows to a 1-month high in one day. Note that the 50-DMA is still holding as resistance.
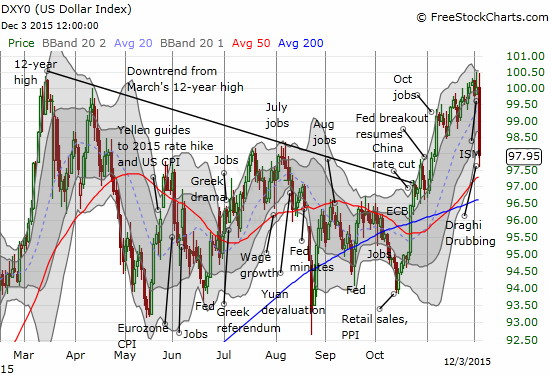
The U.S. dollar index plunged 2.1%. Very conveniently, it is right back to its level right before the jobs report for October.
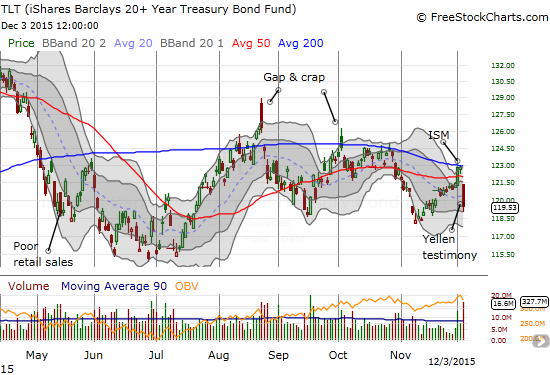
The iShares 20+ Year Treasury Bond (N:TLT) plunged as yields soared. The 200-DMA held as resistance.
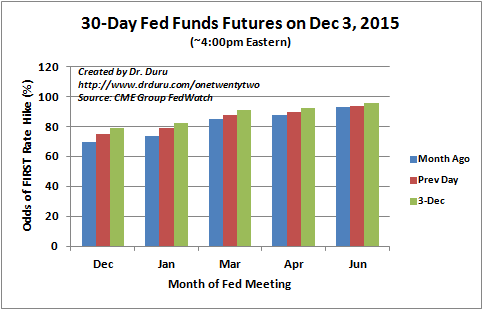
The odds for a December rate hike increased on the day – just about the highest level yet.
If the jobs report extends all of these moves even further, then perhaps we better brace for a December that does indeed get more raucous than usual!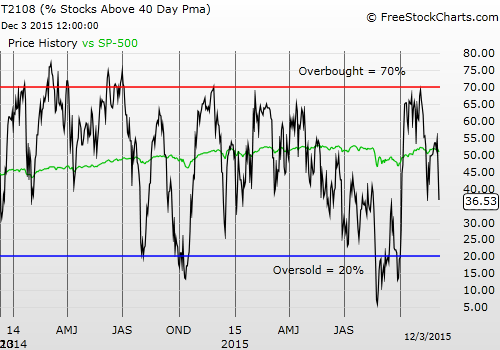
Black line: T2108 (measured on the right); Green line: S&P 500 (for comparative purposes)
Red line: T2108 Overbought (70%); Blue line: T2108 Oversold (20%)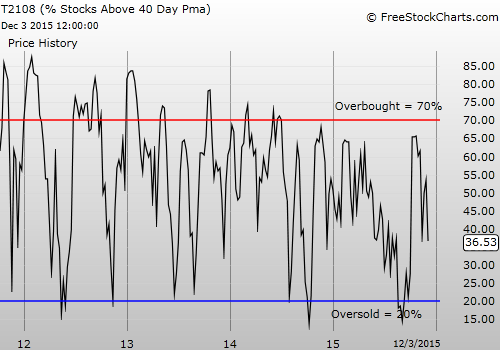
Be careful out there!
Full disclosure: no positions, long CSX (N:CSX) call options
