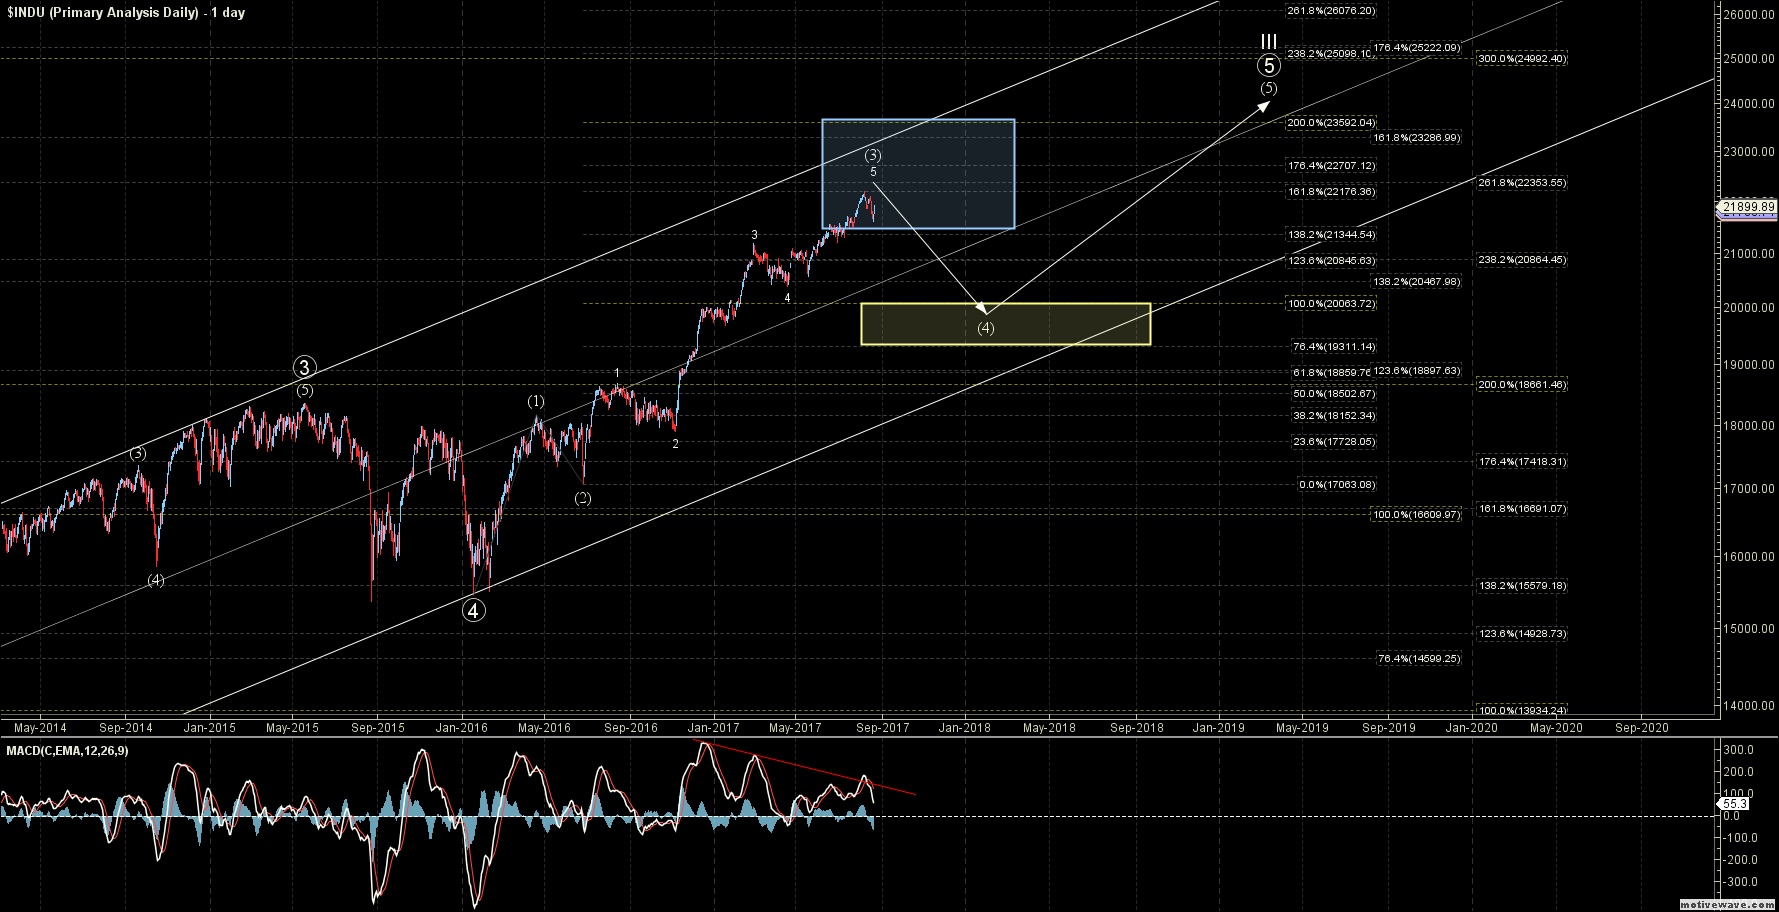
The Dow Jones Industrial Average has moved down close to 600 points off of the high that was struck on August 8th into August 21st lows. Now in percentage terms, this 600 point move is quite a small only representing a move of just 2.6%. In fact, at today’s close, the Dow was only down some 1.2% off of the August 8th high. Furthermore, the move down into the August 21st lows has still not even breached the top of the upper support zone.
The Dow has certainly been trending down over the past two weeks; It does however still has more work to do before we can confirm that a larger degree top in place.

Anecdotal and other sentiment indications
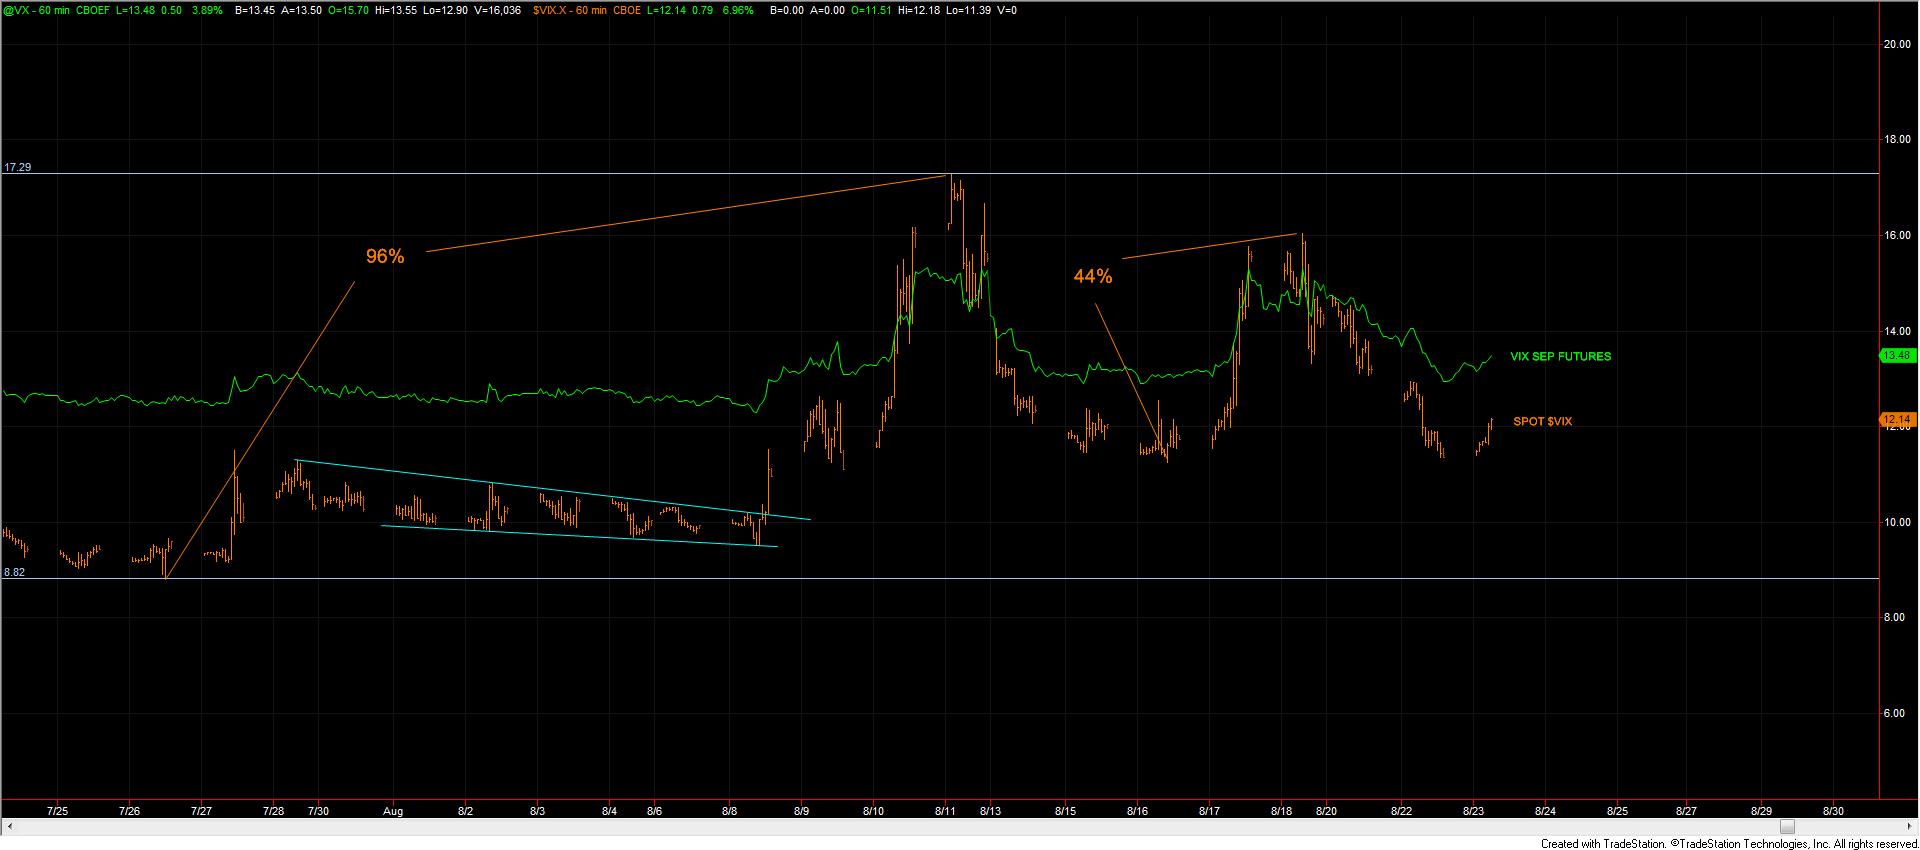
While the Dow dropped a total of only 1.5% from the initial August 8th high into the August 11th low. The VIX index almost doubled during the initial move down off of the highs. It then moved up 44% on the second move down on the Dow from the August 16th high into the August 21st lows. Furthermore, the VXX moved up almost 29% during this initial drop and 12% during the secondary drop.

Given the historically low levels that the VIX had seen over the past several months, a “reset” in Volatility was certainly due. The reaction in the volatility markets, however, was certainly well out of proportion to what we would typically expect to see with such a small drop in the equity markets. Since those highs both the VIX and VXX have
Since those highs both the VIX and iPath S&P 500 VIX Short-Term Futures Exp 30 Jan 2019 (NYSE:VXX) have moved significantly lower but are still trading up off of the lows that were set prior to the start of the move lower in the equity markets.
I am still expecting more volatility in the markets in the coming weeks and months and have written about this here. This expectation would be supportive of the Dow moving lower prior to making new highs once again. With that being said, however, I still remain cautious in this expectation until the Dow is able to at least break back under the August 21st low.

Price pattern sentiment indications and upcoming expectations
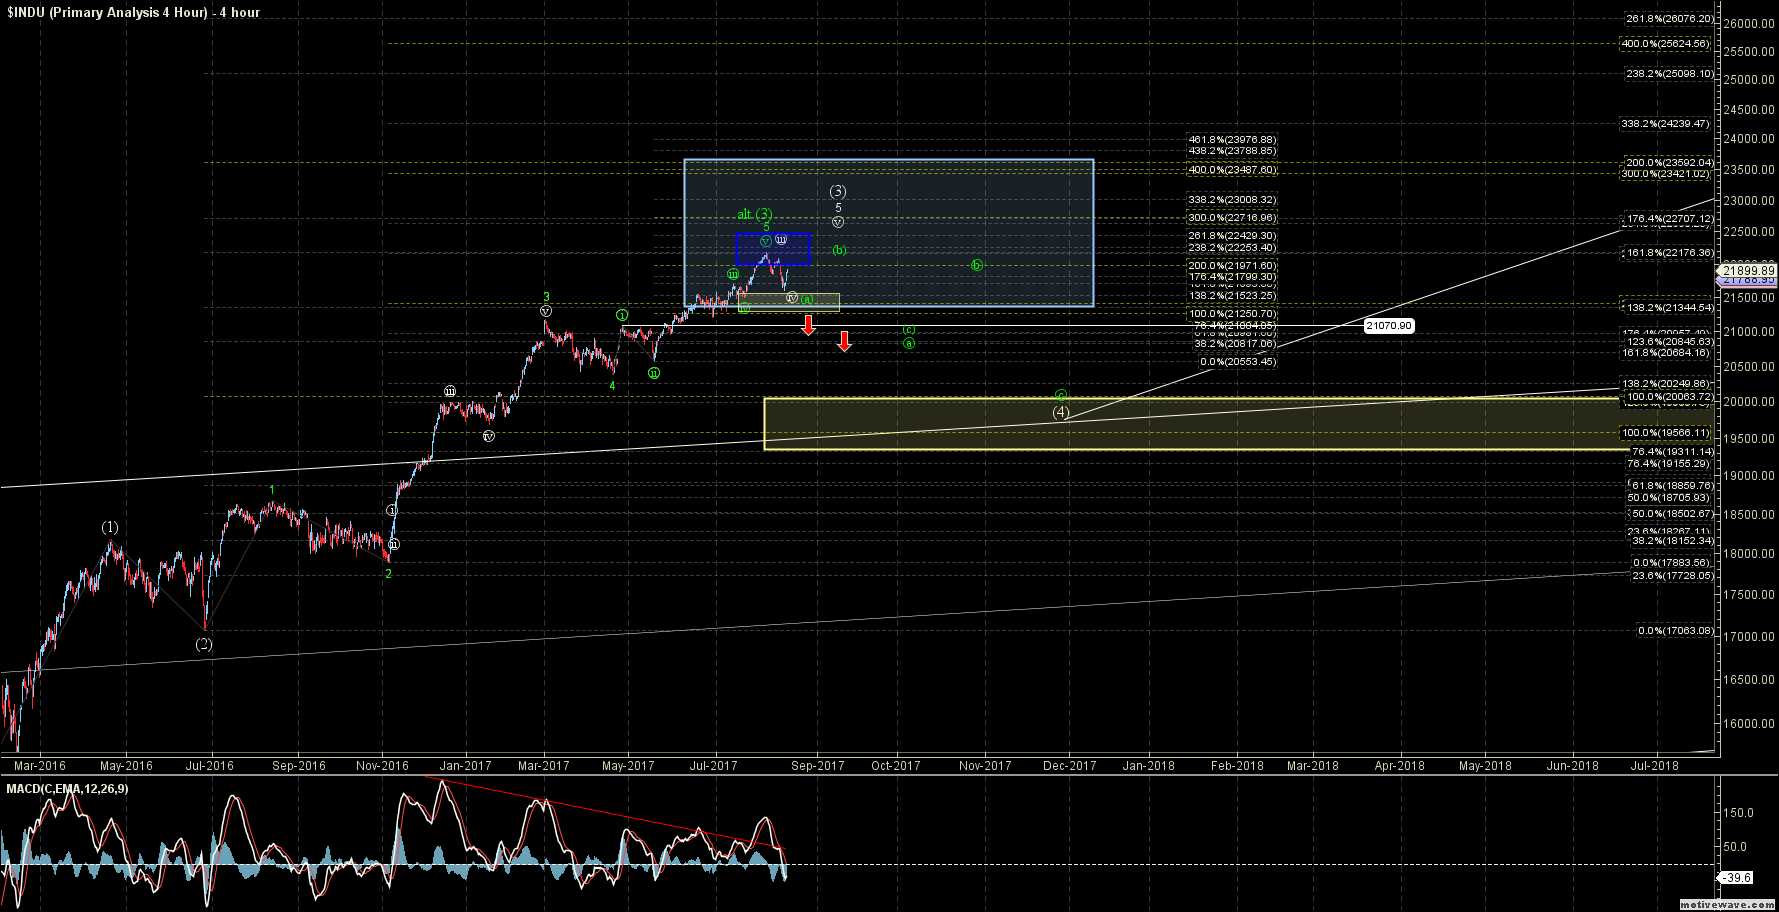
Last week I noted that I would be watching the smaller degree support zone for clues as to whether the Dow had indeed made a larger degree top. That support zone was, and still is, sitting at the 21,523 -21,250. A break of this level would thus signal the start of a corrective move down towards the 20,000 area. On August 21
On August 21st the Dow hit a low of 21,600 just 77 points over the upper end of the support zone. The Dow has now bounced higher in what is now counting best as a corrective pattern off of the August 8th highs.
The move up off of that 21,600 low was fairly sharp but as of the close on August 22nd is still counting best as only being a corrective three wave move. If that move follows through in an impulsive 5 wave pattern and followed by a corrective three wave retracement then it would be the initial signal that the Dow has indeed bottomed in the smaller degree fourth wave as indicated in white on the charts below. Under this white case, the Dow will likely see another move over the August 8
Under this white case, the Dow will likely see another move over the August 8th high prior to topping. This move could potentially take the Dow into the mid 22,000s prior to topping in the larger degree third wave.
Alternatively, if the Dow breaks back below the August 21st low it would give us the initial signal that this has indeed put in a larger degree top as indicated by the green count on the charts. In either of these two
In either of these two cases, the Dow will still likely see lower levels into the fall of this year. As I have noted in my previous articles these lower levels should then be followed by another strong rally that should take us into 2018 and into the 23,500-24,000 level.
So it is true Dow has been trading down over the past several weeks; Until however, it can break back under the August 21st low I still can not count it out just yet.
