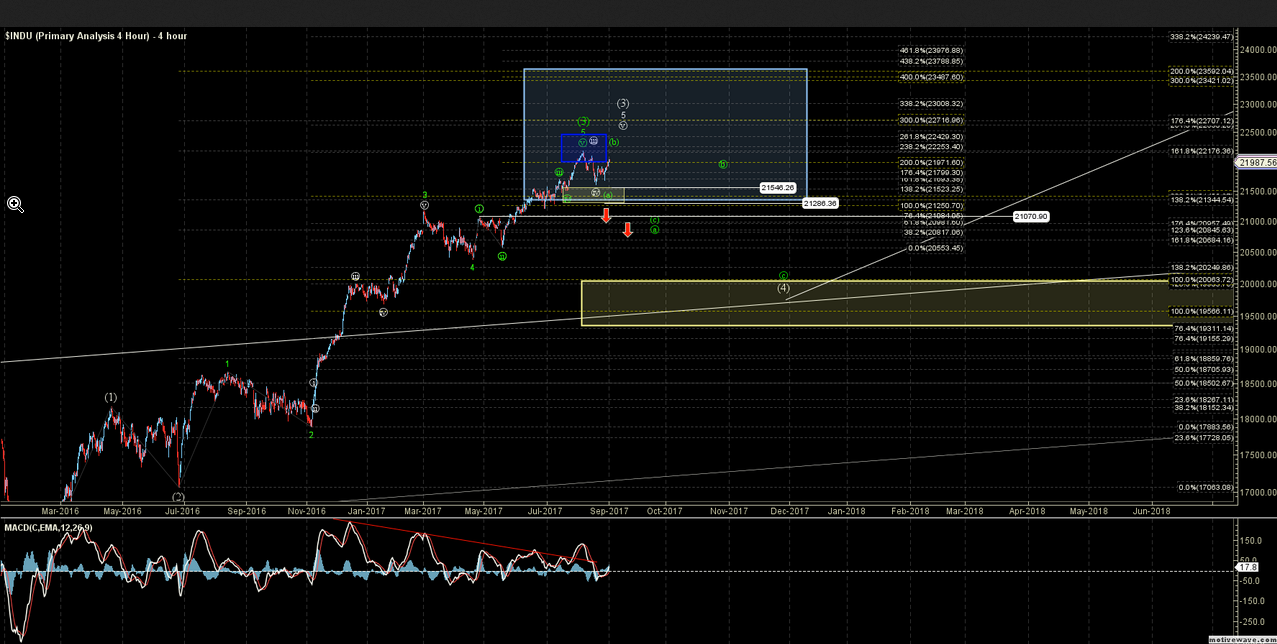
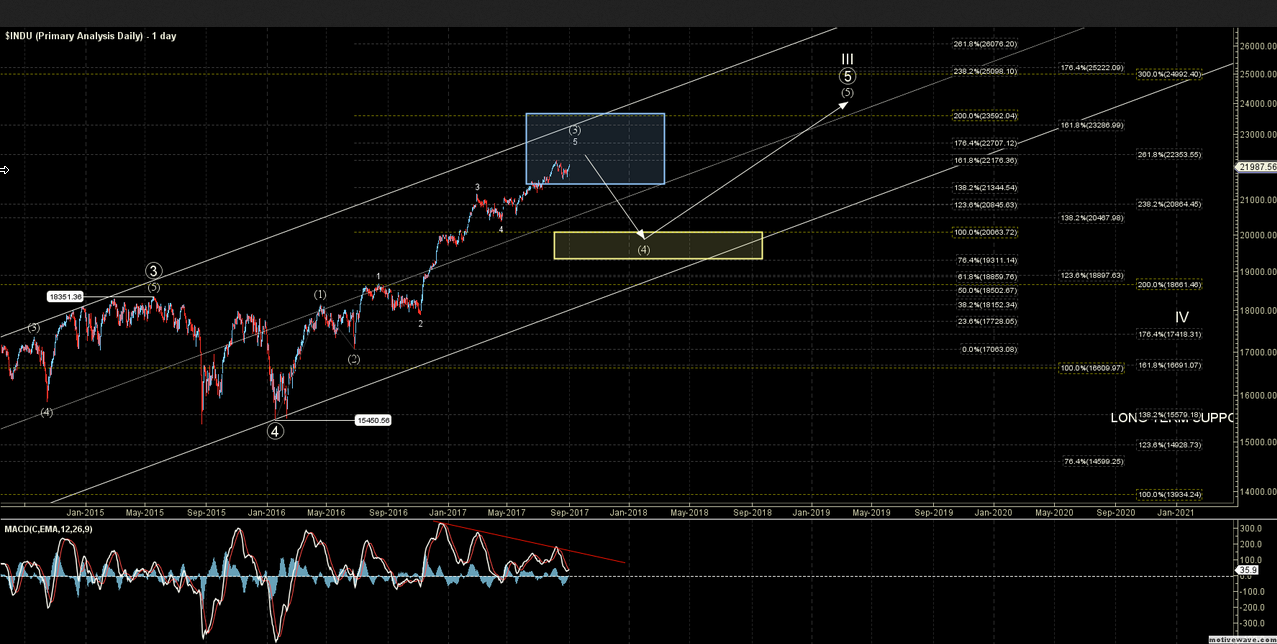
Last week The Dow Jones Industrial Average saw a peek high that was up just over 400 points off of the August 21 lows. This move represented a percentage gain of just under 2% during this 2-week period. Furthermore, this move higher off of the August 21 low retraced exactly 76.4% of the move down into those August 21 lows off of the August 8 highs. The Dow then turned down at that 76.4% retrace level almost to the tick on Friday, September 1 ending the session at 21,987.
So the question for this post-holiday week is will the Dow continue to reward traders who have been buying every dip or is it finally time to sell the Dow on this rip back higher?
I’ve been writing about how the press loves to assign exogenous news events to the price movement within the financial markets. Since the run up off of the January of 2016 lows, we have seen several of these news events occur. From Brexit to the U.S. Election to the Russia Scandal we have seen several "bombshell" news events that were all supposed to crash the market. None of these news events did crash the market as the pundits were so sure that they would as the market continued to grind away higher and higher.
Now that the Dow has finally moved lower after so many months of just grinding away higher and higher, the pundits are now assigning the escalation with North Korea as the reason for the Dow’s move down off of the 22,179 high. This 22,179 high had been an ideal target zone for quite some time and long before the most recent escalation with North Korea had even been in the news.
In fact, on July 11 of this year when the Dow was trading at 21,408 and a month prior to the top at 21,179, I wrote:
If the Dow is able to follow-through in an impulsive pattern up off of that April 18th low then we have an ideal target zone on this smaller degree timeframe right in the 21,971-22,429 zone. This zone has excellent confluence with our larger degree Fibonacci target level of 22,176 as it falls right with that smaller degree target zone.
If the 21,179 level was indeed the top of the larger degree third wave as noted on the charts below, then the target level that I had laid out on July 11th would have been within 3 points of the actual high. Again, this was long before the current North Korea escalation had been in the news. The targets that were laid out were based purely on our Elliot Wave analysis and our Fibonacci Pinball targets. These tools help us measure sentiment in the market based on what we are seeing in the charts. So rather than rely on some exogenous news even we simply rely on measuring market sentiment.
The Dow does still have a bit of work to do before proving that the 21,179 level was indeed the top of the larger degree third wave, but hitting the ideal target within 3 points is certainly a warning sign that should not be ignored.
Two Scenarios
There are two distinct paths that I am currently watching on the Dow. These paths are shown in green and white on the charts below.
The green path would suggest that the Dow has already made a larger degree top in wave (3). This should then result in correction down toward the 20,063-19,311 zone for wave (4) prior to turning up again into 2018.
The white path would suggest that the Dow still needs one final push over the 22,179 level prior to topping in wave (3) before seeing the corrective move back down towards the 20,063-19,311 zone.
Both of these scenarios are suggestive that the Dow will see lower levels into the end of 2017. It is really just a matter of whether the pattern needs another minor high prior to seeing the larger degree top for wave (3).
The initial move down off of the 21,179 level was corrective in nature, and the Dow has so far held over the smaller degree support level of 21,286. So for these reasons we still do not have initial confirmation of a top being in place just yet.
The next signal that the Dow has indeed topped would come with a break of the 21,673 level followed by a break of the 21,597 level. If those two levels can break, then I will once again focus on the 21,286 level as the next signal that we have indeed struck a larger degree top for wave (3). Although a break of the 21,286 level would signal that we have indeed struck fairly significant top, as long as the Dow is able to remain over the long term support levels at 20,063-19,311, there are still likely higher levels to be seen into 2018.
So while traders looking to sell the rip may have their moment in the near term, it would be wise for them to not overstay their welcome.


