We have all seen the puzzles either when we were kids or even now taking our kids out to dinner on their kids meal menus. There is tic-tac-toe, word search and scrambles, and three pictures that look similar but with one different. You are asked to find the one that is different. Can you do it? Do you know why it is different? Don’t look at the bottom of the menu.
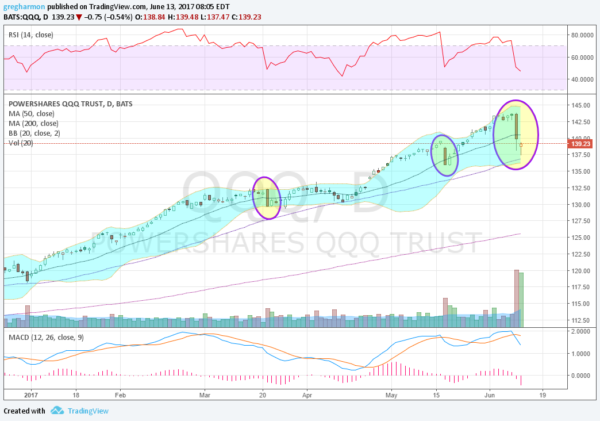
The stock market often gives us similar puzzles to solve. One is showing up in the NASDAQ 100 chart. Since the beginning of the year there have been 3 moves in NASDAQ 100. All 3 have been to the downside. All 3 ended with price crossing the 20 day SMA. In all 3 the momentum indicators reset lower but held in the bullish range (this time TBD still). But that is where the similarity ends.

In the ‘this time is different’ mode, the NASDAQ 100 (shown by the ETF PowerShares QQQ Trust Series 1 (NASDAQ:QQQ) above) dropped on extreme volume. In fact Friday last week saw the highest volume on the QQQ since the August 2015 sell off. Like most price action, this can be interpreted in at least 2 ways.
The first is that it is the beginning of a longer sell off, that there are no more buyers only sellers. Volume in this interpretation is confirming a topping pattern. The second interpretation is that the high volume indicates a capitulation sell off. In this case all the sellers that were out there sold, leaving only buyers. So which one is it?
The early indication is that it is the latter. With the RSI holding up over 40 and the MACD still positive, momentum still is in bullish ranges, but waning. The long lower shadow in the Friday candle shows some recovery (buying), and the Hammer candle Monday is often a reversal candle. Monday’s bullish intraday action was not a show of strength but also not continued weakness. A higher close Tuesday would confirm the Hammer as a reversal and likely attract more dip buyers. As I write in the pre-market, the QQQ is up almost 1/2%.
So how is this different? Just the volume? At this point yes. But a confirmed reversal higher after a capitulation would indicate another strong wave higher. A first target would be about 145.50 on the ETF.
DISCLAIMER: The information in this blog post represents my own opinions and does not contain a recommendation for any particular security or investment. I or my affiliates may hold positions or other interests in securities mentioned in the Blog, please see my Disclaimer page for my full disclaimer.
