The Daily Edge is authored by Ivan Delgado, Head of Market Research at Global Prime. The purpose of this content is to provide an assessment of the market conditions. The report takes an in-depth look of market dynamics, factoring in fundamentals, technicals, inter-market, futures and options, in order to determine daily biases and assist one’s decisions on a regular basis. Feel free to follow Ivan on Twitter & Youtube.
Summary — Jan 4, 2019
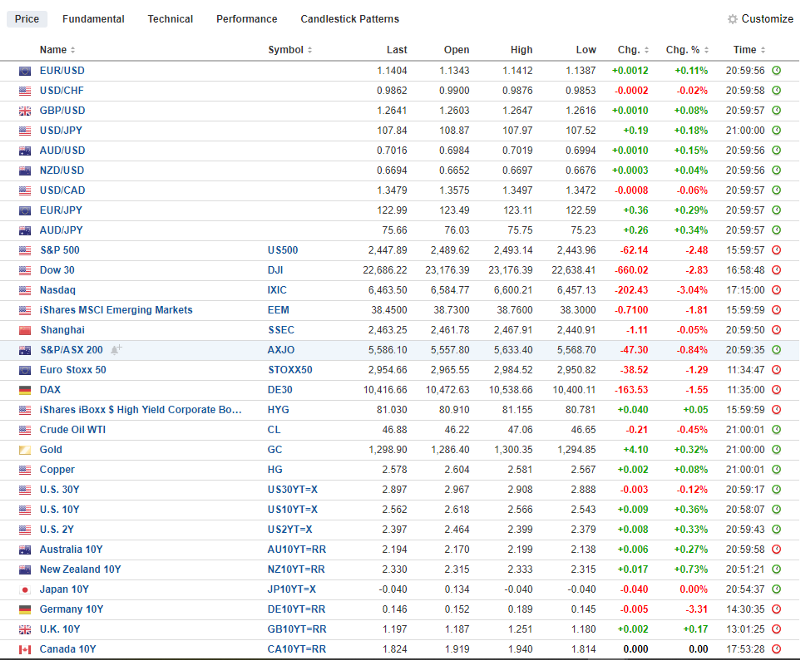
As we head into European trading, we find ourselves in an environment dominated by US Dollar weakness across the board courtesy of further evidence that the “global slow down” phenomenon is sinking in. The turnaround is a radical shift of dynamics from what just 24h ago in what’s been a very lively start of forex trading in 2019 due to the Yen flash surge.
The moves on Jan 3rd carry some important messages that should not be overlooked. First and foremost, it portrays the difficulty that any market will face finding any type of equilibrium when the rubber stretches as much as it did in the event of yesterday’s ‘flash crash’. Unless driven by a major geopolitical event such as the declaration of war or any other black swan-type occurrence, which wasn’t the case during the JPY crosses flash crash, the efficiency of a market will prevent the overextensions of the move to find sufficient players to maintain the overstretched equilibrium as seen.
However, and here is where the main message lies. In light of a US Dollar that ended the day weaker against most of its peers after a quantitative advantage in the hundreds of pips earlier on the day, we really need to question ourselves the outlook for the currency. The background noise in the form of a flattening US curve, 20bp of rate cuts discounted for 2020, the major miss on Thursday’s US ISM PMI sure will keep reverberating in Fed’s Powell head as the case to keep the path of further normalization weakens.
Onto the US ISM. It wasn’t just a mere drop, but it has significance for 2 key reasons. Firstly, it was the sharpest MoM contraction since 2008 (GFC era), and secondly, it makes the case of a dreaded global slowdown more palpable and believable if last year’s poster child (US) is now also starting to limp.
Let’s not forget that this is the year of Central Banks’ date dependency. What this will equate to is that each data point will be taken with a higher degree of relevance to determine the path of least resistance when it comes to setting monetary policy. Countries that accumulate on aggregate a streak of negative economic reports, and it will not take long for considerations that may involve dovish tilts. From the Fed, ECB, RBA, RBNZ, BoC, PBoC, BoJ, BoE. None are in the safe camp when we talk of a context characterized by a global contraction.
I must say that after the poor ISM report (inventory build-up appears to have been the main culprit to keep it as high as of late), and with the US government shutdown still ongoing, the US is off to an ugly start. The cliff is getting steeper for the Fed to climb. While the upbeat ADP jobs report may give the false perception of acting as a consolation, be aware that this data is much more lagging in nature.
What the weak showing in the US ISM manufacturing does, too, is to further cement the view that the global slowdown in growth continues to spread, becoming a global phenomenon. From East to West, China’s industrial and manufacturing data earlier this week undershot and that keeps lowering prospects for economic activity in the whole Asian region, European PMIs have been underperforming for some time now, the UK remains a political mess, and now we get this US ISM. You get the picture.
The global slowdown so well-telegraphed in late 2018 via the decline in the prices of crude oil or the synchronized flattenings of the yield curves around the world is today, more than yesterday, a reality quickly sinking into the psyche of the market. Let’s not forget that the acknowledgment by Apple (NASDAQ:AAPL) that China is a market in deep trouble where revenue prospects are no longer what they used to be, on its own, carries enough substance to be very wary. Even Kevin Hassett, Trump’s advisor, said today he predicts a “heck of a lot” of US companies to follow Apple in lowering its revenue guidance in China.
Shifting gears, in today’s report, I find no reason to revert the focus in the overall risk-off sentiment, which appears to have become a perpetual feature of my daily takes. It’s just what it is. We find ourselves with prolonged flatter yield curves globally (worsened prospects for growth), US bonds on an absolute tear as a preferred shelter amid the recent topsy-turvy movements, Gold continuing its majestic run to the upside as $1,300.00 comes into contact, and the ES rolling over.
In the next 24h, there will be 2 major events to keep in mind. The first comes in the form of the US NFP payrolls, where calls are fairly optimistic, including for a marginal pick up in earnings MoM. Equally, if not more important given the market context, is the speech by Fed’s Chairman Jerome Powell, due to participating in a panel discussion titled “Federal Reserve Chairs: Joint Interview” at the American Economic Association’s Annual Meeting.
No End In Sight For Risk-Off Conditions
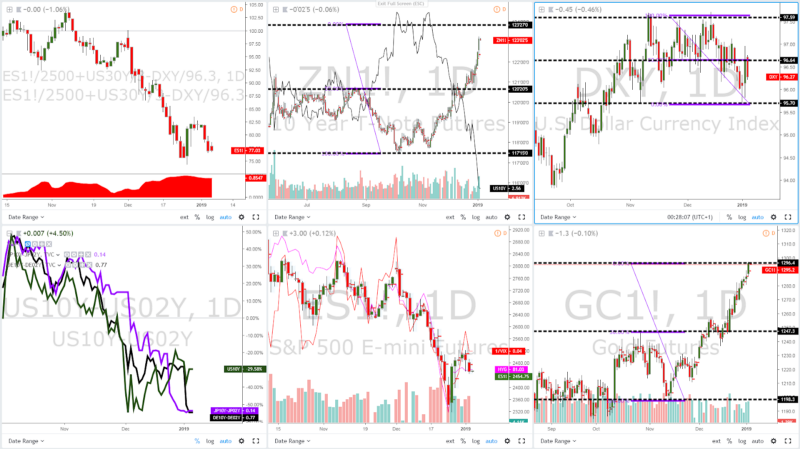
The risk index remains under pressure circa 75.41 with no signs in the horizon of a sea change any time soon. The environment is dominated by US Dollar weakness with equities offered, hence why we are seeing risk still on the backfoot. The late 2018 risk-off theme stays for now.
Access the chart via Tradingview
The bid caught by US fixed income accelerated further with ZN1! (10y US bonds) exhibiting the highest volume since Dec 6 of last year. The 10y now exchanges hands at 2.56% and given the sharp moves seen, I’ve drawn a more macro projected target, which means there might be further room for bonds to appreciate. Besides, most of the volume is now found trapped on the lower end of Thursday’s range. It’s not looking good for the US Dollar.
Akin to the surge in US bonds, Gold continues its stellar performance but with a much-needed caveat to be aware of. The precious metal has now met its 100% projected target + faces $1.3k overhead. The bullish rhythm is clear and you don’t want to fight it, but if there is an area in the entire trend where significant bouts of profit-taking may be present, around this periphery it is.
The bearish outlook for US equities continues intact, especially on the back of Apple’s poor revenue guidance. The sell-side candle on the ES mini closed near the lows of the day, and as in the case of the US bond dynamics, weak-handed buyers ended up finding themselves trapped long wrong-sided judging by where the PoC (Point of Control) is vs the daily candle close. More pain is possible and I am afraid that neither the VIX nor the HYG (junk bonds) gives us opposing signals.
In the US Dollar index, I am paying attention to the range structure 97.6–95.7 with a midpoint of 96.65, which is critical to help us understand the US Dollar outlook going forward. Ever since the range was established back in mid-October, the index spent the majority of its time on the top 50%. However, as 2019 got underway, we saw this critical mid-point broken. If the index can consolidate on the bottom-side of its range, it harbingers a poorer outlook for the currency. If it breaks higher, then we know what’s the next level of resistance as a reference (97.6).
Last but not least, if we look at the tendencies of the yield curves out of Germany, the US, or Japan, we can extract a clear message. The market envisions an environment of poor growth, which again, should keep the reflationary profile at bay and the overall outlook for risk dire.
Charts Insights: What Are You Missing?
EUR/USD — Best Risk Reward At The Edges Of The Perpetual Range
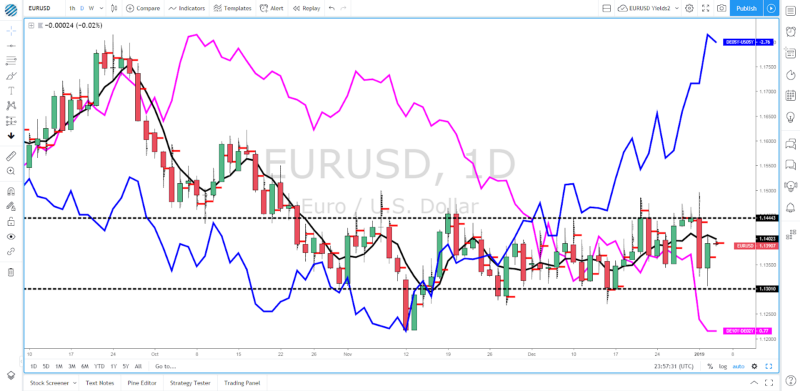
I’ve been endorsing to play EUR from the long-side against the US Dollar on the basis that the spread between the German and the US bond yields is screaming the pricing of the pair remains at a significant discount. However, I still find it hard to believe we can break much higher beyond 1.15 knowing that the German yield curve is also hinting the ECB is facing a tough challenge in 2019 in order to exit its stimulus program and revert back to normalization. The magenta line (German yield curve) keeps the upside limited, while the blue line (German vs US yield spread) provide the downside cap.
The end result appears to be, more stagnant and low vol conditions between 1.13–1.15. Note, the rejection away from 1.15 round number on Jan 2nd should speak volumes of the conviction that still exist to be a seller on strength, while Jan 3rd bullish rejection cements my range-type view. Be aware, that with implied volatility running above historical by a small margin, it does suggest that a small risk for the range to be broken exist, mainly due to the current risk-off environment. Bottom line, keep playing the range at the extremes for the best possible risk-reward opportunities.
GBP/USD — Wide Range To Cover Short Term Eventualities
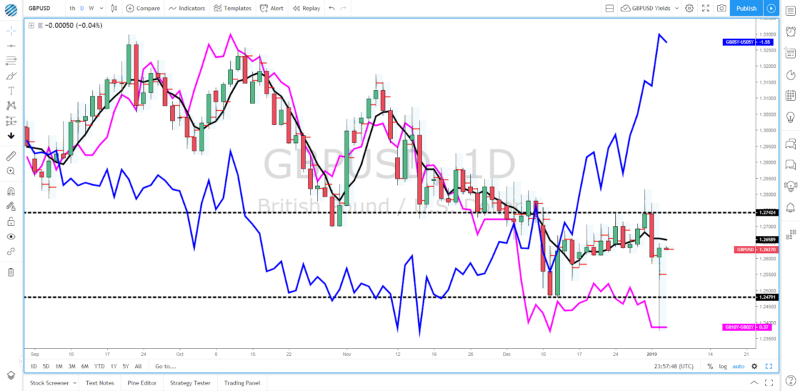
Just 24h ago I mentioned that, similar to the outlook in the EUR/USD, any downside resolution in the Sterling, unless driven by negative Brexit headlines, would have a hard time finding acceptance sun 1.125.
The reason lies on the increasingly obvious divergence in the UK vs US bond yield spread. Think about it, investors worldwide can exchange their USDs or local currency for GBPs at a major discounted rate, which gives them more firepower to then allocate greater sums into higher-yielding Gilts (UK bonds).
But again, analogous to my explanation on the EUR/USD, the unresolved Brexit issues is a fundamental risk that is keeping the upside (1.27 and above) well capped. The daily candle rejection is the best testament to the view laid out here. It’s basically communicating that the market is far from prepared to find equilibrium at these low levels.
Also, consider the levels of implied vs historical volatility on the Sterling for the next 7 days as a suggestion that the chances of the 1.2750–1.25 to be broken being quite thin. Once the UK parliament reconvenes on Jan 9, and as clearly reflected in implied vols 2 weeks forward and beyond, the risk of a range breakout should creep up on the meaningful vote, due Jan 15th.
USD/JPY — A Technical Look Beyond The ‘Flash Crash’
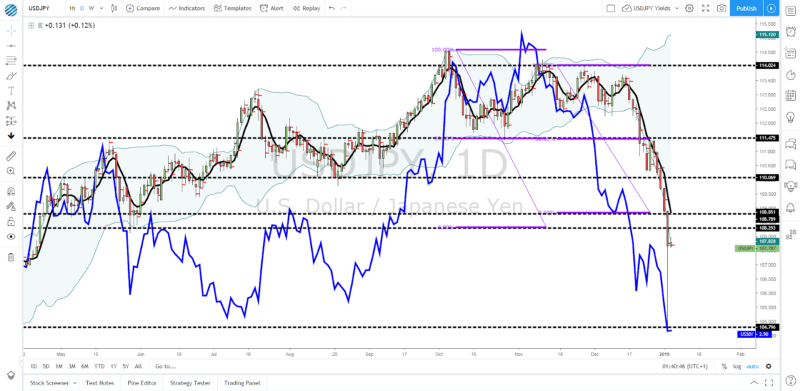
On the aftermath of the Yen flash surge, it’s reasonable to have produced such a major correction away from an unjustified sub 105.00 level. However, as the dust settles, unlike the sense of victory by bulls on that Sterling bullish candle print, USD/JPY buyers are far from being in such position.
The losses experienced in the last 24 on a closing basis (down by over 120p) are well justified as the full-blown bullish rally in US bonds (lower US yields) extends, which when combined with lower equities, it will only exacerbate the pains in the pricing of the pair.
The key question we need to ask ourselves now is, what levels to the upside would start to justify re-engaging in topside sell-side action? You will notice in the chart above, I’ve drawn a couple of 100% projection targets, which due to the flash crash, were unequivocally broken. The first one at 108.82 under a time of more efficient markets, while the second target at 108.30 was taken out on the ‘flash’ event.
What this means is that on the way up, and amid a treacherous context for risk, I’d expect the the 108.85–30 to act as the first level of sticky resistance. Judging by where the US 30y bond yield stands, there is just simply no case to be made for a long-lasting recovery in the pair for now.
NZD/USD — Opportunity To Buy On Weakness w/Yield Spread Edge
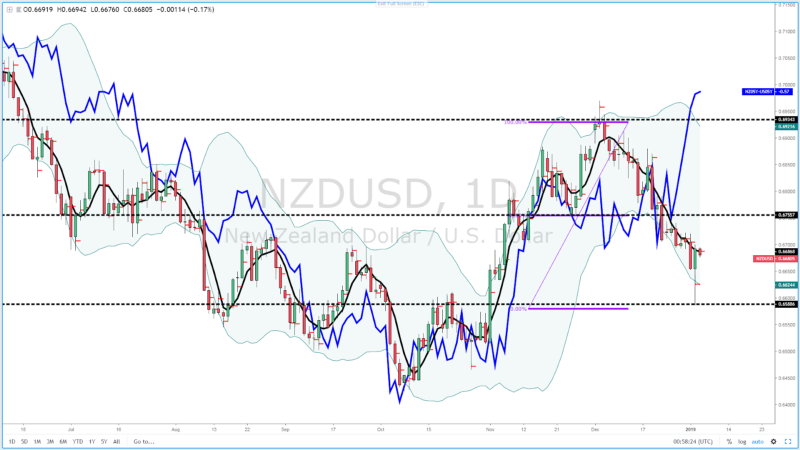
This is a pair that has caught my attention this morning. The best play here would have been buy it on the way down as the 0.66 round number was re-tested, considering the major divergence between the NZ and US bond yield spread. The decline also met the 100% projection target but not only that, you could have been leaning at the origin of a demand area from Oct 31st. The bullish print on Thursday, nonetheless, suggest that a follow-up buy-side campaign on weakness makes sense in line with the dominant weekly trend, plus the evidence of volume trapped on the wrong side.
Important Footnotes
- Risk model: The fact that financial markets have become so intertwined and dynamic makes it essential to stay constantly in tune with market conditions and adapt to new environments. This prop model will assist you to gauge the context that you are trading so that you can significantly reduce the downside risks. To understand the principles applied in the assessment of this model, refer to the tutorial How to Unpack Risk Sentiment Profiles
- Cycles: Markets evolve in cycles followed by a period of distribution and/or accumulation. The weekly cycles are highlighted in red, blue refers to the daily, while the black lines represent the hourly cycles. To understand the principles applied in the assessment of cycles, refer to the tutorial How To Read Market Structures In Forex
- POC: It refers to the point of control. It represents the areas of most interest by trading volume and should act as walls of bids/offers that may result in price reversals. The volume profile analysis tracks trading activity over a specified time period at specified price levels. The study reveals the constant evolution of the market auction process. If you wish to find out more about the importance of the POC, refer to the tutorial How to Read Volume Profile Structures
- Tick Volume: Price updates activity provides great insights into the actual buy or sell-side commitment to be engaged into a specific directional movement. Studies validate that price updates (tick volume) are highly correlated to actual traded volume, with the correlation being very high, when looking at hourly data. If you wish to find out more about the importance tick volume, refer to the tutorial on Why Is Tick Volume Important To Monitor?
- Horizontal Support/Resistance: Unlike levels of dynamic support or resistance or more subjective measurements such as fibonacci retracements, pivot points, trendlines, or other forms of reactive areas, the horizontal lines of support and resistance are universal concepts used by the majority of market participants. It, therefore, makes the areas the most widely followed and relevant to monitor.
- Trendlines: Besides the horizontal lines, trendlines are helpful as a visual representation of the trend. The trendlines are drawn respecting a series of rules that determine the validation of a new cycle being created. Therefore, these trendline drawn in the chart hinge to a certain interpretation of market structures.
- Correlations: Each forex pair has a series of highly correlated assets to assess valuations. This type of study is called inter-market analysis and it involves scoping out anomalies in the ever-evolving global interconnectivity between equities, bonds, currencies, and commodities. If you would like to understand more about this concept, refer to the tutorial How Divergence In Correlated Assets Can Help You Add An Edge.
- Fundamentals: It’s important to highlight that the daily market outlook provided in this report is subject to the impact of the fundamental news. Any unexpected news may cause the price to behave erratically in the short term.
- Projection Targets: The usefulness of the 100% projection resides in the symmetry and harmonic relationships of market cycles. By drawing a 100% projection, you can anticipate the area in the chart where some type of pause and potential reversals in price is likely to occur, due to 1. The side in control of the cycle takes profits 2. Counter-trend positions are added by contrarian players 3. These are price points where limit orders are set by market-makers. You can find out more by reading the tutorial on The Magical 100% Fibonacci Projection


