
The State of Affairs in Financial Markets — January 14
Following the overstretched pessimism in which we started the year, the short-term relief rally in financial markets keeps on going. A combination of factors keeps supporting the overall risk. The constructive headlines coming out of the Sino-US trade negotiations remains an important development stimulating the risk on tone, with further signs that both parties aim to find a more protracted compromise after the confirmation that the Chinese Vice Premier plans to visit the US by month-end. More to latch on for risk seekers?
The lingering positive effects on the back of the dovish turn at the helm of the Fed continues to play out in favor of risk as well. The wait-and-see narrative is feeding through, sustaining risk. The immediate consequences ever since Fed’s Chairman Powell caved in to the market’s demand for a pause in the normalization process has been to drive the US dollar lower as the expectations for a long pause in the Fed rate hike cycle and a potential adjustment of its shrinking balance sheet is being factored in the markets.
Besides, there is no doubt that all Fed members are now undeniably on the same camp, pinning words such as patience, flexibility, prudence, on top of their minds when addressing the press. A market-imposed unifying view.
The latest shoe to drop for the dovish rhetoric to go full circle came courtesy of Fed’s Vice Chairman Richard Clarida, who recognized the need for a sustained pause, the moderate improvements in global growth, the tightening of financial conditions or the possibility of shifting course in the Fed’s balance sheet strategy should it be warranted by market events.
Risk appetite conditions have therefore solidified even if we are far from being out of the woods. It’s become obvious for quite some time now that our risk-weighted index has been commanded higher mainly by the recovery in the S&P 500 as the correlation indicates. That’s why one must be mindful that the ES is fast approaching the key make or break point that led to the liquidity event last year. It implies that should sellers find enough value to create a supply imbalance off this area, risk off conditions looks poised to deteriorate again. The behavior in Gold prices also promotes the notion that the market has scaled down its fears, even if the poor performance in the US dollar means that the bullish trend is far from experiencing a technical compromise. The yellow metal has taken a pause on its bullish momentum after reaching its 100% projected target ahead of $1.3k.

Some critical technical cracks in the US dollar index (DXY), the EUR/USD as a proxy or the Chinese yuan have manifested as a consequence of the dovish turn by the Fed even if the euro has shown a lack of impetus beyond 1.15. The run in economic data out of the Eurozone has been atrocious, and it has become blatantly clear that it’s the countries at the core of the Union (Germany, France) that no longer can hide their miseries either as recently shown by the appalling industrial production figures, which adds to the existing weakening trends in the manufacturing sector. Throw into the mix the revolts in France by the yellow vest protesters, now in the hundreds of thousands, and the outlook gets even gloomier for Europe.
ECB’s Draghi is due to testify on the ECB’s 2017 Annual Report before the European Parliament, and one wonders, with the obvious economic data, if he could walk back his over-optimism. As in the case of the Fed, it seems only a matter of time until the ECB adopts a more realistic view of present market conditions, which may further undermine the outlook for a late-year rate hike. Once the ECB starts to highlight the risk in the EZ from ‘broadly balanced’ to ‘titled to the downside’ in coming meetings, that’s when the market will get the evidence it needs to price out a 2019 normalization.
If we were to witness further weakness in the US dollar, especially if it comes combined with an increase in volatility in financial markets via renewed selling in global equities, a theme that we must pay very close attention is the reduction in USD-denominated carry-motivated flows. US money markets have seen a massive increase in foreign holdings via EUR, JPY funding to take advantage of the rate differentials. If the volatility resumes again, the reduction in the carry trade exposure could keep pushing the USD into new lows, acting as an accelerant of the structural weakness present.
A risk to be aware of that may eventuate in further USD fragility due to the prolonged US government shutdown since this Saturday officially the longest in history. According to Fox Business, Trump is looking to end the impasse with a government emergency declaration soon. There are many legal question marks on whether or not this move would be even lawful.
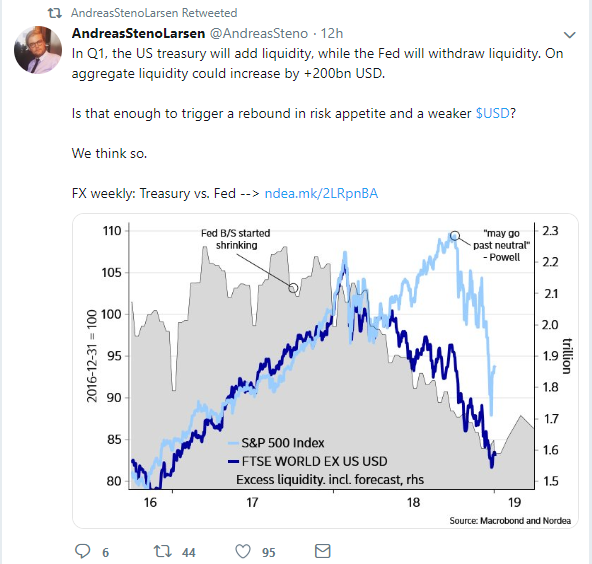
Andreas Steno Larsen, Senior Global FX/FI Strategist at Nordea Markets, commented on this underlying risk for the USD in Q1 last week:
“The likely upcoming debt ceiling excess liquidity surge is interesting, as liquidity developments will then be at odds with the Feds balance sheet trend.” The increase on liquidity due to the adjustments required by the Treasury may translate in USD weakness.
The run-up in the Chinese yuan is critically important to monitor too, as it only makes the need for China to reach a trade deal with the US a more compelling outcome to achieve in order to address its economic slowdown. The entire world is keeping a close eye on how the talks evolve as calls for a global recession, make no mistake, do come driven by the significant loss of momentum in China. All countries are dependable of the initial psychological/sentiment impact and the subsequent potentially positive economic ramifications that a Chinese trade deal with the US would exhibit.
The Chinese government, via its different state-control arms, has enacted a new set of stimulatory policies, including a 1% cut in its banks’ reserve requirement ratios to try to stimulate the economy, which remains in a state of disarray as the trend in the Chinese QoQ economic indicators indicate (vehicles sales, industrial productions, fixed asset investments, trade activity).
There are a number of reasons to expect higher volatility this week. Firstly, UK PM May is set to finally face the meaningful vote of the Brexit deal, with the prospects of a defeat running very high. It’s been reported that over 200 MPs may oppose to the drafted deal negotiated with the EU.
The question, therefore, becomes what next? Judging by the performance in the sterling, there seems to be a growing line of thinking that is buying into the notion that the UK will eventually manage to negotiate an extension of article 50, even if at this stage, with the EU not willing to cave in to further concessions, it means simply delaying the inevitable. One could argue that some glimmers of hopes over the 2nd referendum on Brexit, even if misplaced by the lack of any evidence, have been priced into the latest GBP run up. If the idea of an article 50 extension starts to dissipate to instead resolve the current conundrum via a hard Brexit by late March, the sterling should suffer.
Another volatility accelerant this week includes the US earnings season getting underway, with traditional banks the highlights, including JP Morgan (NYSE:JPM), Bank of America (NYSE:BAC), Goldman Sachs (NYSE:GS) to name a few. If we were to focus on other events to drive sentiment, today’s China’s trade balance offers an excellent opportunity to keep assessing the state of affairs in China.
Charts Insights: What Are You Missing?
EUR/USD — Bullish Structure Despite Latest Setback

The breakout of the saturated range structure last week has so far failed to find follow through. My bullish bias and long exposure remain undeterred nonetheless, as the trade ticks enough boxes to remain committed to the long-bias. On the daily chart, we can clearly observe that the bullish resolution comes in line with the divergence in the German vs US bond yield spread, which argues for any retest of the previous area of resistance (on a closing basis) at 1.1440–50 an exceptional area to consider engaging in long-side business. By drawing the volume profile, clear symmetries emerge, allowing us to identify the POC of the multi-month range at 1.1375 area with the extremes at 1.1307–1.1448, hence why it’s so vitally important to hold the latter for the uptrend to resume. This constructive outlook comes in stark contrast with the European fundamentals, but as I’ve argued, this is a movement led by broad-based USD weakness. Also notice, last week’s close beyond 1.15 achieved the creation of a fresh bullish cycle high, with the extension from Jan 3rd low to the recent high greater in magnitude (260 pips) than the previous leg up of 207 pips. This bullish structure has emerged on the back of a debilitating bearish structure seen from Oct to Nov of 2018.
GBP/USD — Decoupling From DXY Ahead Of Brexit Vote

Friday’s bullish outside day has shifted the focus towards the further upside. The breakout occurs despite the weakness present in the EUR/USD in the last 2 days, clearly implying that this GBP-centric move is predicated on the hopes that a positive Brexit outcome may emerge this week in the form of an extension of the article 50. On the lower windows, you can observe the decoupling of the GBP/USD with the EUR/USD in a magenta line. The bullish breakout of the sticky resistance at 1.28 (POC November) alongside the rising UK vs US bond yield spread does reinforce the view that short-term bullish risk exists, even if one must be mindful that vol is set to pick up substantially from Jan 15 when the UK parliament is set to move forward with the Brexit meaningful vote. Any setbacks now face 3 critical macro areas at 1.28–2785, followed by 1.2712 ahead of the Dec POC at 1.2650–55.
USD/JPY — Bullish Reversals Off Market Makers Territory

Again, this is a market where market symmetries can assist us to determine our short-term bias. Ever since the recovery above 108.40 (100% project target), the daily price action has provided enough evidence of this area being actively traded by market makers and short-term momentum accounts looking to adjust valuations. The upward slope in the 5-day moving average is another positive input I am personally factoring in. The last 2 daily prints, trapping volume to the downside while achieving bullish closes is a clear reminder that upward risks are building up as long as the risk environment remains sustained. I am personally holding a near-term long bias in this market, as the achievement of the projected target of 100% has been backed by price action and sustainable risk. I remain very versatile to change my views to bearish if we can achieve a close sub 108.40 with a deterioration in the risk tone. If this scenario eventuates, a potential resumption of the downtrend is on the cards.

Find below today’s implied / historical vol levels.
* If implied vol is below historical vol, represented by a ratio < 1% in the table above, the market tends to seek equilibrium by being long vega (volatility) via the buying of options. This is when gamma scalping is most present to keep positions delta neutral, which tends to result in markets more trappy/rotational. On the contrary, if implied vol is above historical vol, represented by a ratio > 1%, we are faced with a market that carries more unlimited risks given the increased activity to sell expensive volatility (puts), hence why it tends to result in a more directional market profile when breaks occur. The sellers of puts must hedge their risk by selling on bearish breakouts and vice versa.

Important Footnotes
- Risk model: The fact that financial markets have become so intertwined and dynamic makes it essential to stay constantly in tune with market conditions and adapt to new environments. This prop model will assist you to gauge the context that you are trading so that you can significantly reduce the downside risks. To understand the principles applied in the assessment of this model, refer to the tutorial How to Unpack Risk Sentiment Profiles
- Cycles: Markets evolve in cycles followed by a period of distribution and/or accumulation. The weekly cycles are highlighted in red, blue refers to the daily, while the black lines represent the hourly cycles. To understand the principles applied in the assessment of cycles, refer to the tutorial How To Read Market Structures In Forex
- POC: It refers to the point of control. It represents the areas of most interest by trading volume and should act as walls of bids/offers that may result in price reversals. The volume profile analysis tracks trading activity over a specified time period at specified price levels. The study reveals the constant evolution of the market auction process. If you wish to find out more about the importance of the POC, refer to the tutorial How to Read Volume Profile Structures
- Tick Volume: Price updates activity provides great insights into the actual buy or sell-side commitment to be engaged into a specific directional movement. Studies validate that price updates (tick volume) are highly correlated to actual traded volume, with the correlation being very high, when looking at hourly data. If you wish to find out more about the importance tick volume, refer to the tutorial on Why Is Tick Volume Important To Monitor?
- Horizontal Support/Resistance: Unlike levels of dynamic support or resistance or more subjective measurements such as fibonacci retracements, pivot points, trendlines, or other forms of reactive areas, the horizontal lines of support and resistance are universal concepts used by the majority of market participants. It, therefore, makes the areas the most widely followed and relevant to monitor. The Ultimate Guide To Identify Areas Of High Interest In Any Market
- Trendlines: Besides the horizontal lines, trendlines are helpful as a visual representation of the trend. The trendlines are drawn respecting a series of rules that determine the validation of a new cycle being created. Therefore, these trendline drawn in the chart hinges to a certain interpretation of market structures.
- Correlations: Each forex pair has a series of highly correlated assets to assess valuations. This type of study is called inter-market analysis and it involves scoping out anomalies in the ever-evolving global interconnectivity between equities, bonds, currencies, and commodities. If you would like to understand more about this concept, refer to the tutorial How Divergence In Correlated Assets Can Help You Add An Edge.
- Fundamentals: It’s important to highlight that the daily market outlook provided in this report is subject to the impact of the fundamental news. Any unexpected news may cause the price to behave erratically in the short term.
- Projection Targets: The usefulness of the 100% projection resides in the symmetry and harmonic relationships of market cycles. By drawing a 100% projection, you can anticipate the area in the chart where some type of pause and potential reversals in price is likely to occur, due to 1. The side in control of the cycle takes profits 2. Counter-trend positions are added by contrarian players 3. These are price points where limit orders are set by market-makers. You can find out more by reading the tutorial on The Magical 100% Fibonacci Projection