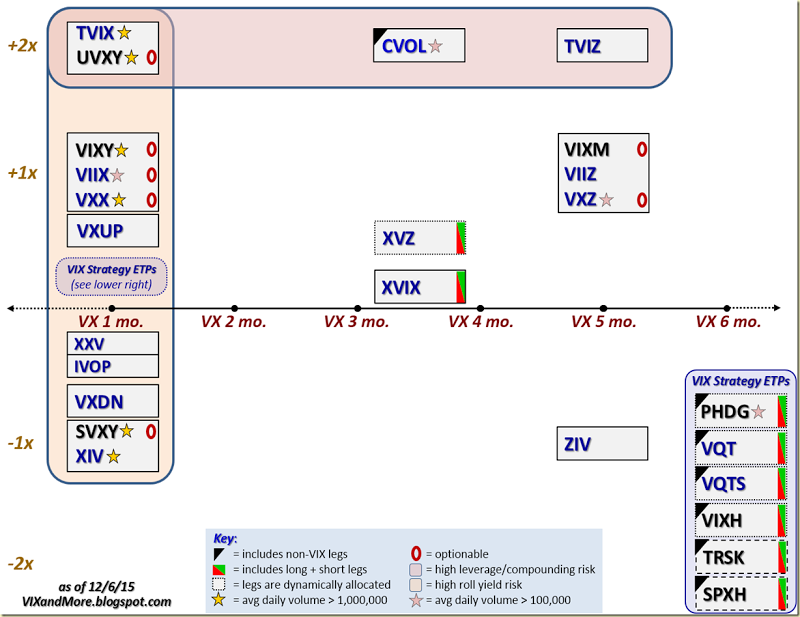
I have been writing about VIX ETPs since the launch of the initial duo of iPath S&P 500 VIX Short-Term Futures Exp 30 Jan 2019 (N:VXX) and iPath S&P 500 VIX Mid Term Futures Exp 30 Jan 2019 (N:VXZ) back in January 2009 and from 2010 onward I have been plotting all of them on a leverage/maturity grid like the one below. It is amazing how often various VIX ETP investors mentioned one of these charts when I talk to them. Even through the VIX ETP space has been relatively stable as of late, I have not updated this graphic since early 2014, so a refresh is long overdue.
For those who have not been following along over the years, I have plotted every VIX-based ETP using leverage on the Y-axis and maturity on the X-axis. With the advent of what I am calling VIX strategy ETPs, I have isolated in their own box in the lower right hand corner a half dozen of these products whose characteristics do not necessarily imply a fixed point on Cartesian coordinate system.
The key at the bottom highlights various salient features of each of these products. From previous incarnations, I have retained the presence of non-VIX legs (typically positions in SPX/SPY), the combination of both long and short legs, dynamic allocation of the legs and optionability. I have also shaded areas where there is high leverage/compounding risk as well as high roll yield risk. Not surprisingly, these risks converge at VelocityShares Daily 2x VIX Short Term linked to SP 500 VIX Short Fut Exp 4 Dec 2030 (O:TVIX) and ProShares Ultra VIX Short-Term Futures (N:UVXY), two of the more infamous VIX ETPs. This time around I have also added yellow stars for those ETPs with an average daily volume of 1,000,000 or higher and pink stars for ETPs with an average daily volume between 100,000 and 1,000,000. Note that while C-Tracks Citi Volatility Total Return (N:CVOL) technically makes the cut, at today’s closing price of 0.40, any sort of meaningful reverse split to raise the price about 5 or 10 would highlight just how illiquid this issue is. In fact, only six VIX ETPs pass the one million share screen: VelocityShares Daily 2x VIX Short Term linked to SP 500 VIX Short Fut Exp 4 Dec 2030 (O:TVIX), ProShares Ultra VIX Short-Term Futures (N:UVXY), ProShares VIX Short-Term Futures (N:VIXY), iPath S&P 500 VIX Short-Term Futures Exp 30 Jan 2019 (N:VXX), ProShares Short VIX Short-Term Futures (N:SVXY) and VelocityShares Daily Inverse VIX Short Term linked To SP 500 VIX Short Fut Exp 4 Dec 2030 (O:XIV).

There are three new additions to this graphic. The most notable of these are AccuShares Spot CBOE VIX Up (O:VXUP) and AccuShares Spot CBOE VIX Down (O:VXDN), which were launched by AccuShares back in May. These products deserve a post (or series of posts) dedicated to some of the issues surrounding them, but the short version is that high complexity, frequent distributions and consistent tracking errors resulted in a product that investors decided was not worth their trouble. The other “new” products is, UBS ETRACS SP 500 VEQTOR Switch (N:VQTS), the first ETP that tracks the UBS ETRACS SP 500 VEQTOR Switch (N:VQTS), making it a relative of Barclays (L:BARC) + S&P VEQTOR Exp 08 Sep 2020 (N:VQT) and PowerShares S&P 500 Downside Hedged Portfolio (N:PHDG), but one which uses a dynamic allocation to VIX futures to achieve a 10% target realized (historical) volatility. VQTS was launched in December 2014 and like most VIX ETPs, has struggled to reach critical mass.
While the VIX ETP market is showing some signs of maturing, there are many new and exciting developments in terms of low volatility ETPs and more broadly in the ETP space in general.
Disclosure(s): net short VIX, VXX, UVXY and TVIX; net long SVXY, XIV and ZIV at time of writing
