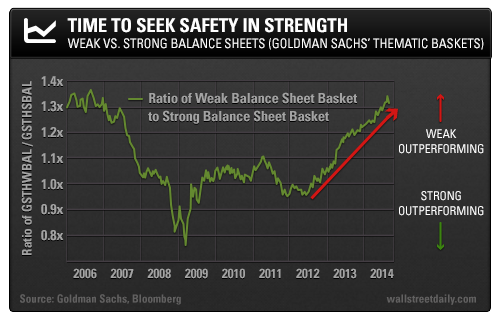
One of the most fascinating developments of the stock market rally over the past few years has been the killer performance of companies with less-than-stellar financial situations.
Companies with weak balance sheets have actually outperformed those with strong balance sheets.
However, this dynamic isn’t as counterintuitive as it may seem.
We can’t simply buy companies with rock-solid balance sheets and expect them to crush the market all the time!
Don’t worry, though. If you’ve refused to follow the herd into stocks of the most highly leveraged companies, your discipline is about to pay off…
The Money Volcano Effect
Federal Reserve stimulus – pumping billions of dollars of liquidity into the market through quantitative easing (QE) – has definitely been a main factor driving the search for risk…
Indeed, companies with poor credit qualities tend to do even better than their conservatively run counterparts when credit market conditions are robust.
In August 2012, Fed Chairman Ben Bernanke hinted that further stimulus was imminent. Sure enough, the Fed committed to buying $40 billion in mortgage backed securities (MBS) in September 2012.
Well, $40 billion just isn’t what it used to be. So the Fed announced $45 billion in monthly Treasury purchases in December 2012. That’s $85 billion in combined monthly asset purchases.
This money volcano compelled herds of investors to bid up risk assets (i.e., corporate bonds and stocks). Correspondingly, weak balance sheet stocks went on a tear.

The chart above compares the relative performance of the “weak balance sheet” and “strong balance sheet” thematic baskets of stocks created by Goldman Sachs Group (NYSE:GS). Goldman uses the Altman Z-score, a weighted sum of five key financial ratios, to help determine relative balance sheet strength.
But can such a sustained, powerful trend continue indefinitely?
Not a chance…
We should always ask ourselves if something has changed…
Bonds Lead Stocks
The recent 3% decline in the S&P 500 could be attributed to heightened geopolitical risk associated with Russia.
However, the bond market was signaling a shift several weeks before the S&P 500 peaked on July 24.
High-yield bonds peaked around the end of June. The BofA Merrill Lynch U.S. High Yield Master II Index hit a yield of 5.16% on June 23, the lowest yield for this benchmark on record. The popular iShares High Yield Corporate Bond ETF (ARCA:HYG) peaked on June 25.
Since then, high-yield bond fund outflows have accelerated, with three straight weeks of large withdrawals.
Anyone who heeded my warning about the PIMCO High Income Fund (PHK) on June 20 was able to sidestep a 13% drawdown. PHK is a leveraged closed-end fund with exposure to investment-grade and high-yield credit that was (and still is) trading at a high premium to net asset value.
The action in the credit markets is a very big deal…
Bonds are higher in the capital structure than a company’s equity. Therefore, deterioration in a company’s perceived credit quality has a profound, negative impact on a company’s stock.
Many equity strategists hate to admit that QE has been the driving force of the rally. They’re desperate to believe that company fundamentals justify where stock prices have been propelled.
Arguably, it’s been a credit-based rally, and QE is the impetus.
With credit spreads starting to widen in anticipation of the end of the current QE program later this year, stocks of companies with solid balance sheets are poised to outperform.
Always remember… the credit markets lead, and equities follow.
Next week, I’ll introduce a pairs trade that benefits from this potential market shift.
Safe (and high-yield) investing,
Alan Gula, CFA
