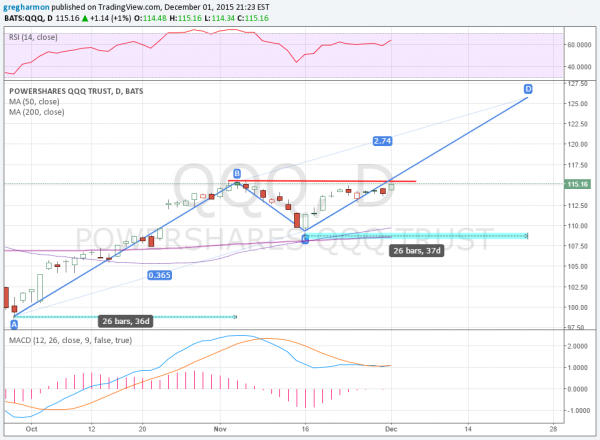
The Nasdaq 100 was the last major index to make a new all time high after the financial crisis that bottomed in 2009. But the ETF tracking the Nasdaq 100, O:QQQ, is yet to do so. Tuesday’s move higher is the first step in the process of correcting that last step. Tuesday’s close was the highest in over 14 years. Only the intraday action from early November probed higher, but not by much.
The low on November 16 also set a Golden Cross in place, with the 50 day SMA crossing up through the 200 day SMA. This is a bullish event. Now at the early November high, the last hurdle is in place and it is time to watch for the trigger points and targets, should it break to the upside. Lets examine the chart.

The movement since the September 29 low has now got to the point of triggering an AB=CD pattern. This pattern is one of the few in technical analysis that gives not only a target to the upside but an estimate of when it might happen.
The rise off of the September low ended after 26 trading days. This gives an estimate of December 23 of a potential top in the QQQ. An early Christmas gift. And the rise from the September low, the November high suggests the top could come at 125.78. That would finally give the new all time high that all other ETFs have seen, and by over 5 points! Quite a Christmas gift.
Disclaimer: The information in this blog post represents my own opinions and does not contain a recommendation for any particular security or investment. I or my affiliates may hold positions or other interests in securities mentioned in the Blog. Please see my Disclaimer page for my full disclaimer.
