This article was written exclusively for Investing.com
- Production cuts are working
- US output continues to decline
- The trend is your friend, and it's higher; weak dollar supports gains in the crude oil futures market
Crude oil is still the energy commodity that powers the world. Though the trend towards alternative energy products with lower environmental impact than hydrocarbons continues to spur a replacement of oil, crude remains a critical energy product.
In April 2020, the price of nearby NYMEX futures fell to the lowest price in history when the May contract reached negative $40.32 per barrel. Since then, the futures market has made higher lows and higher highs. The wide level of contango or premium for deferred delivery reflected the massive oversupply as the demand for oil evaporated when the coronavirus spread across the globe.
However, producers have adjusted their output to balance the fundamental equation in the oil market. The active month September contract traded to a low of $21.99 per barrel in late April, over $62 per barrel higher than the May contract. The unprecedented wide contango reflected the glut conditions in the oil market.
Since April, the trend in the crude oil futures arena has been higher. At the end of last week, there were no signs that the slow crawl to the upside was in danger. Crude oil tends to take the stairs higher and an elevator to the downside. The energy commodity continued to climb those steps as of Aug. 14.
Production cuts are working
After the demand for crude oil dramatically declined in February through April, on the back of the spread of coronavirus around the globe, OPEC, Russia, and other world producers decided to cut their combined daily output by almost ten million barrels per day. The unprecedented reduction lasted until the end of July.
The resulting rebound in the price of the energy commodity to the $40 per barrel level on NYMEX crude oil futures and slightly above there on the Brent futures caused the oil-producing countries to taper their cut to the 7.7 million barrel per day level in August.
The massive production cut pushed the price to the $40 per barrel level as it went a long way to balance the supply and demand fundamentals of the market.
US output continues to decline
The United States is the world’s leading producer of crude oil. In mid-March, daily output rose to a record of 13.1 million barrels per day. Over the past months, the decline in prices led to a decrease in production.
According to the EIA, as of August 7, the US was producing 10.7 million barrels each day, a decline of 18.3% from the high. According to Baker Hughes, the number of oil rigs operating in the US stood at 172 as of August 14, 598 lower than at the same time one year ago.
US crude oil output declined alongside the production from other producing countries.
Meanwhile, the trend in crude oil and oil product inventories in the US reflects falling output over the past three weeks.

Source: EIA
The Energy Information Administration reported three consecutive weeks of falling crude oil inventories as of August 7. Stockpiles fell by 22.5 million barrels since the week ending on July 24. While gasoline stocks moved marginally higher by 419,000 barrels over the period, distillate stocks fell by 200,000 barrels. Daily output declined by 400,000 barrels per day over the past three weeks.

Source: API
Over the same period, the American Petroleum Institute reported a reduction of 19.817 million barrels of stockpiles. Gasoline inventories fell by 1.966 million barrels, while distillate stocks were 1.062 million barrels higher. The decline in inventories, falling daily production, and the substantial drop in the number of operating oil rigs all add up to falling US output.
The trend is your friend, and it's higher; weak dollar supports gains in crude oil futures market
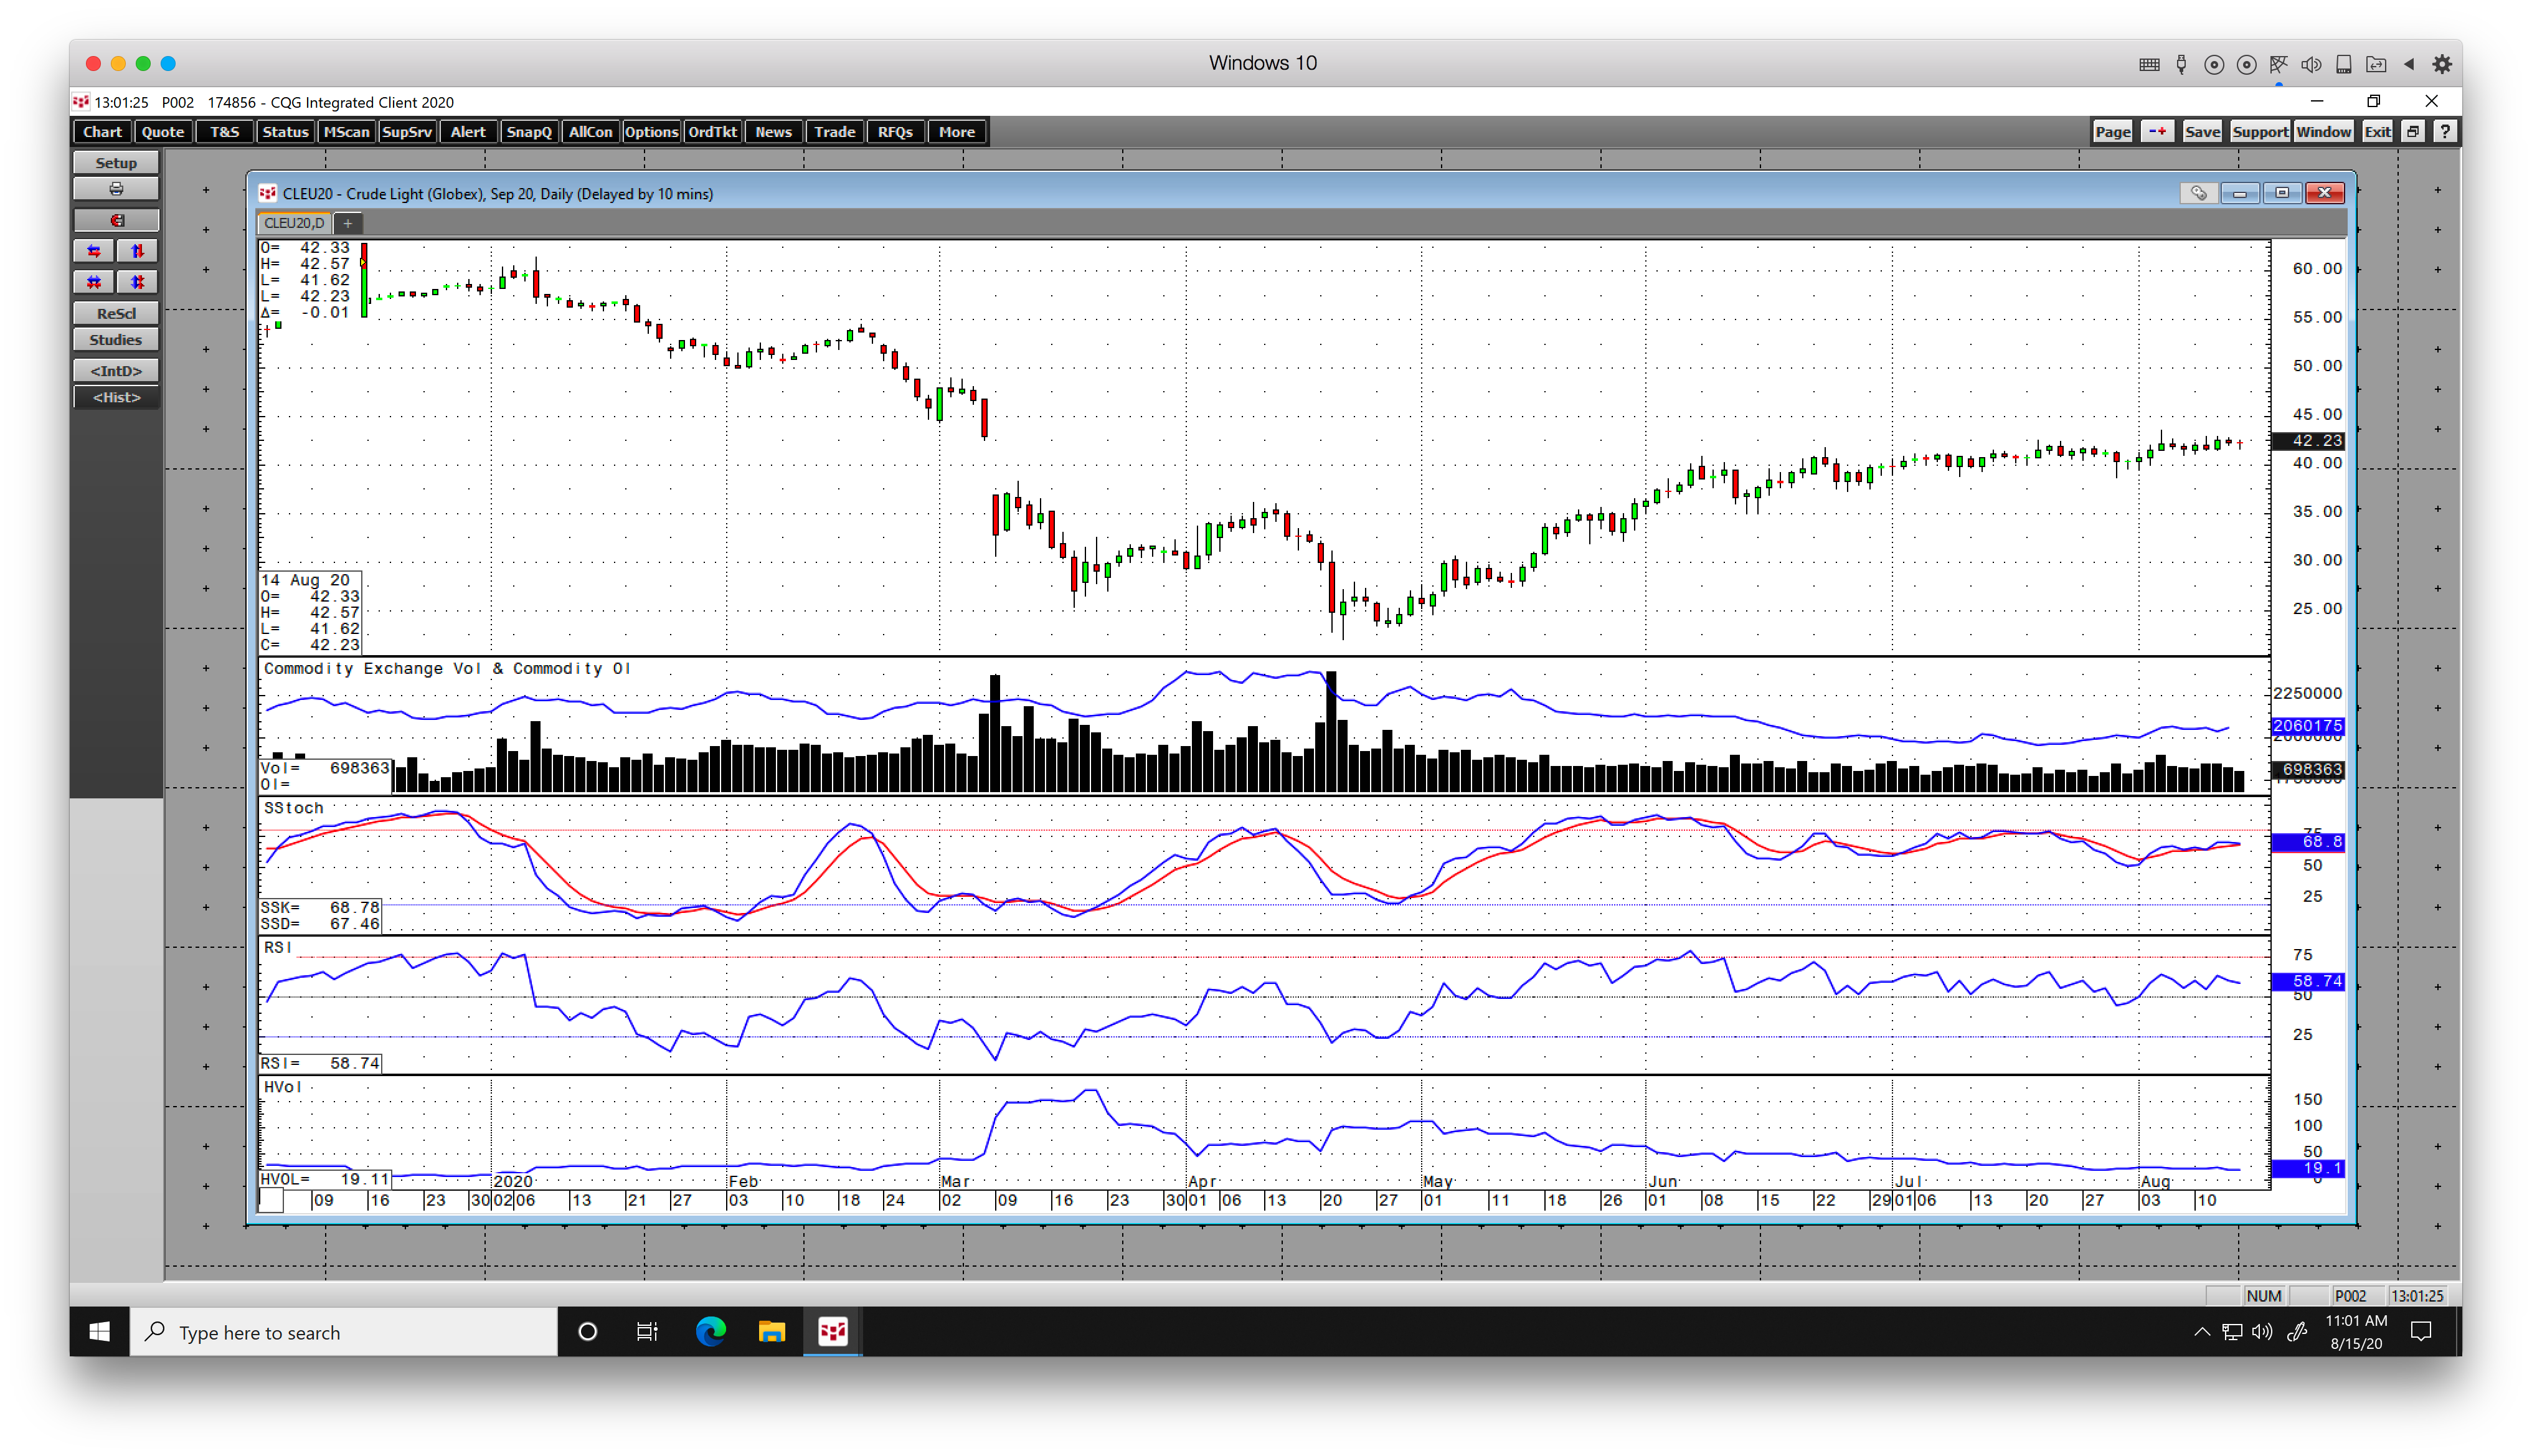
Since late April, the price trend in the crude oil market has been higher. The energy commodity took an elevator shaft to the downside from late February through late April before taking the stairs higher back to over the $40 level on the nearby September NYMEX futures contract.

Source: CQG
As the daily chart, above, highlights, price momentum and relative strength in the crude oil futures market was sitting above a neutral reading at the end of last week. Daily historical volatility at just over the 19% level declined from a high of over 171% in mid-March as daily trading ranges have narrowed.
The total number of open long and short positions in the crude oil market at 2.060 million contracts hit a low of 1.957 million in July. It has been gently rising with the price, which is typically a technical validation of a bullish price trend in a futures market.
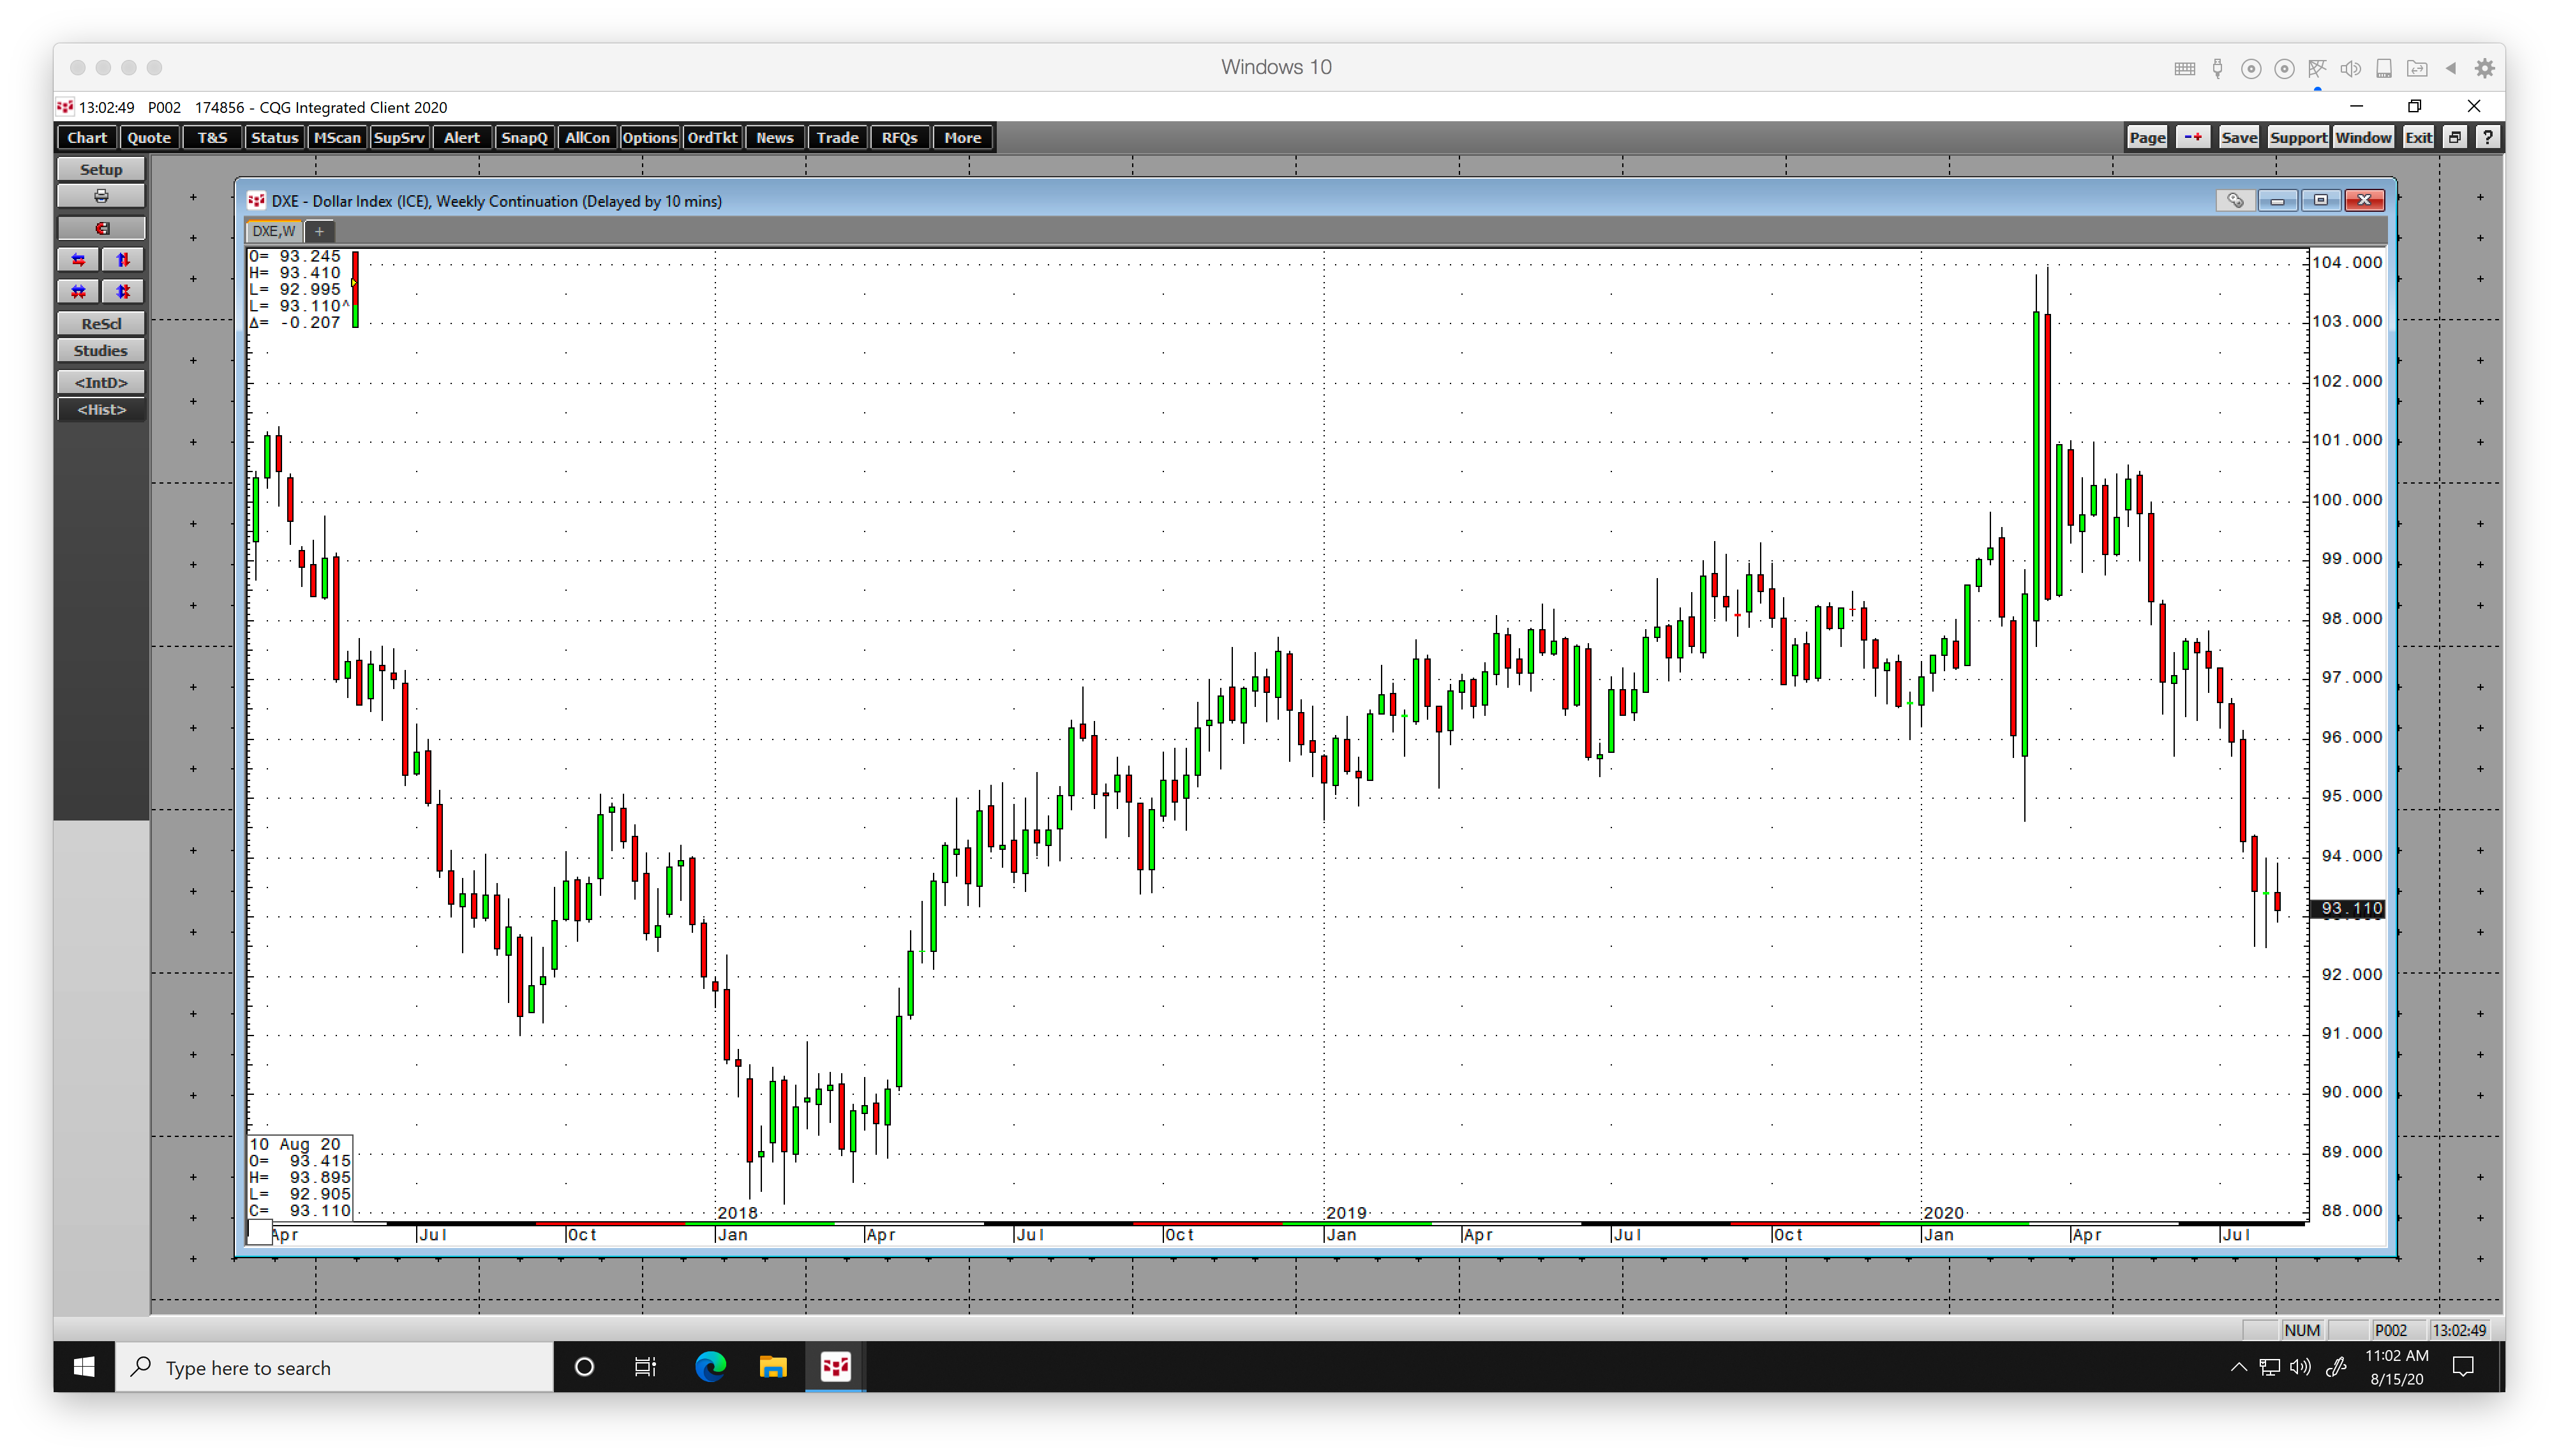
Meanwhile, the Dollar Index has declined since hitting its highest level since 2002 at 103.96 in March. 
Source: CQG
The weekly chart of the Dollar Index, above, shows that it reached a low at 92.475 during the first week of April and was sitting at the 93.11 level at the end of last week. A weak dollar tends to be supportive of commodity prices.
The falling dollar, declining global production, and decreasing US inventories of crude oil are bullish for the price of the energy commodity. Nearby September NYMEX futures were trading near the recent high at the $42.23 per barrel level at the end of last week. The current targets on the upside are $43.52, the Aug. 5 high, $48.97, the March 3 peak, and $54.55, the top from Feb. 20. With fundamental and technical factors pointing higher, crude oil is likely to remain on the staircase to the upside over the coming weeks.
