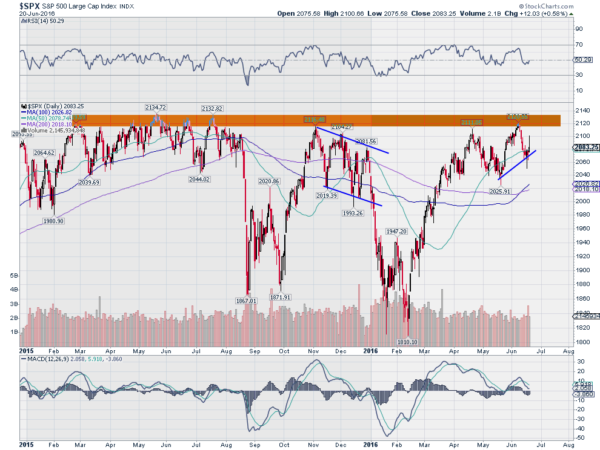
Eight times, the range from 2115 to 2135 has stopped the S&P 500 from advancing. A narrow 20-point range. Less than 1% of the index value. Very thin. But it has acted as an impenetrable brick wall each time.
Brick walls can stand without cracking or breaking hundreds of years. This one has only been in place for 16 months. Is it crazy to think it might be broken so soon?
I do not know if it will be broken, but that entire 16 months can be viewed as a correction. Most times when you talk about a correction it is very noticeable in a chart. A deep pullback, like what happened in 2008.
There are a couple of pullbacks in the chart below. But the deepest is only 15% - not the 20% that many look for as a ‘correction’.

So is the S&P 500 still waiting for that 20% correction? I cannot read the future, no one can. But I can tell you that the market does not need to correct 20% before it can move higher. Markets can correct through a deep drop. But they can also correct through time.
This market has been doing that for the last 16 months. That is quite enough for it to move higher. Again, I do not know if it will move higher right now, or take another 5 months or not at all. But it has been through a long correction. 15% and 16 months.
It looks promising on a short-term basis right now. After the rise off of the drop to 1810, the brick wall halted it again. The seventh time. The pullback from there was shallow, just 85 points. From there, a higher high was made at 2120 before a pullback to a higher low at 2050.
Higher highs and higher lows define an uptrend. The RSI is holding in the bullish zone after a pullback as well. If this continues, a ninth time at the wall could be in the cards soon. Will it break this time or hold firm?
Disclaimer: The information in this blog post represents my own opinions and does not contain a recommendation for any particular security or investment. I or my affiliates may hold positions or other interests in securities mentioned in the blog, please see my Disclaimer page for my full disclaimer.
