I had been postulating a short-term oversold stock-market rally based on what I observed in the term structure of VIX (see Still bearish, but watch for the dead-cat bounce).
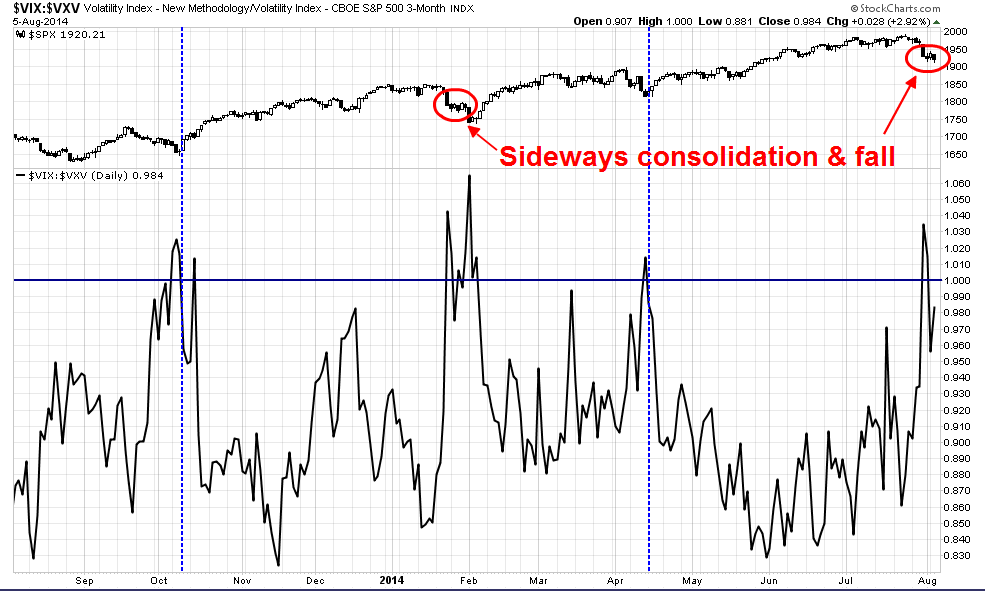
Since then, we saw a minor bounce on Monday and the market failed to follow through Tuesday. I have been thinking about a second scenario where stock prices, instead of rallying when the VIX/VXV ratio exits an inverted condition (dotted vertical lines), consolidate and fall as they did in late January.
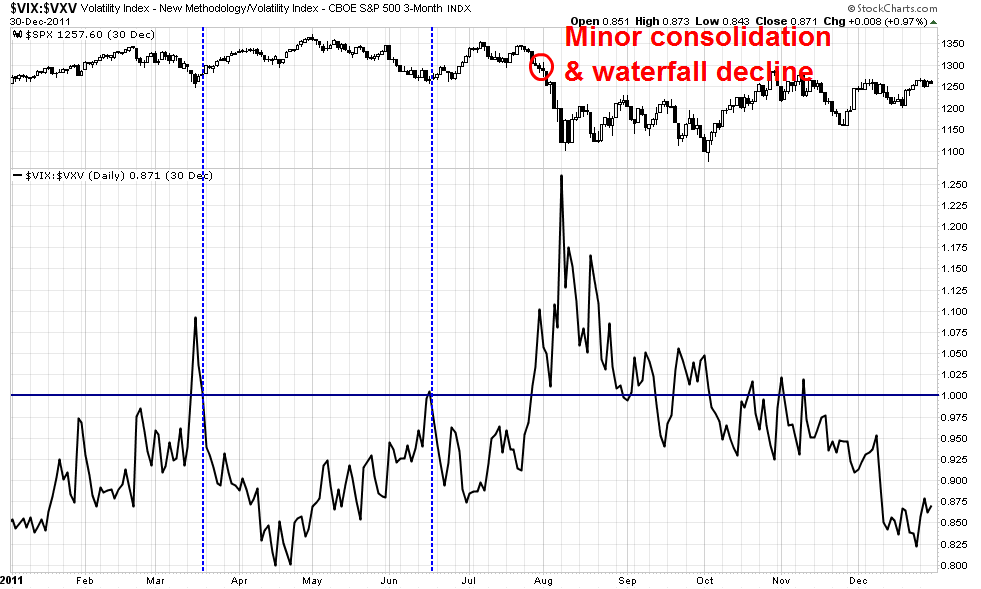
We can find more evidence of this kind of pattern in the corrective episode in 2011. When VIX/VXV ratio inverted in August and mean reverted, we saw a brief period of minor consolidation only to be followed by a waterfall decline into the final corrective low.
By contrast, the dotted vertical lines depict periods when the market did rally after exiting VIX/VXV inversion. The difference seems to be the market`s behavior in the critical two or three days after exiting inversion. Did it see a sustainable rally, or consolidate sideways. If it`s the latter, the risk of further declines are very real.
In the current case, I believe that we have to seriously look at the latter scenario as the base case. Since the Trend Model has already flashed a trading sell signal (see Global growth scare = Trend Model downgrade), it`s time for my inner trader to get bearish again.
Disclosure: Long SPXU


