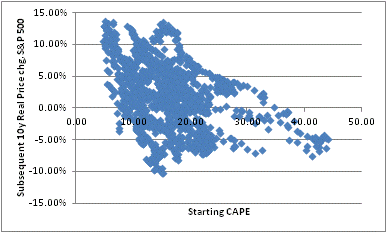
We can do the math. We can, until we are blue in the face, explain to investors why 10% returns in the equity market…even 7% returns…are unlikely going forward. We can show the picture below, sourced from data from Robert J Shiller, illustrating that high starting cyclically-adjusted PE ratios are associated with low future returns (the current level of the CAPE is about 29.5), and admonish that higher levels of the CAPE have been seen on only a few occasions that we all agree ex-post were bubbles.
We can do all this, and yet investors still anticipate that 10-20% returns will be delivered by equities going forward. The pessimistic ones think that only 5-10% is what we will see, ‘in line with historical returns’ that are as high as that of course only because our measurement ends at the current high levels. None of our arguments are new, and research illustrating that investors in the main do not get out just in time to avoid the bear market is hopelessly general because each individual enjoys his or her personal fable: “yeah, but I’m not that guy.”
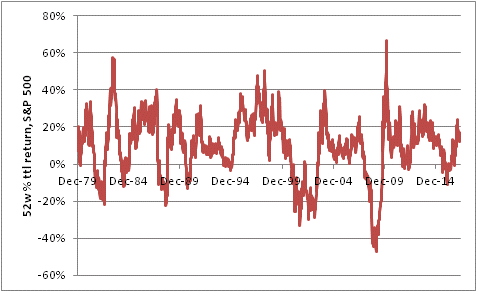
They can be forgiven, perhaps, their poor memories because, after all, the bad events have been few and far between (at least, the bad events in terms of market returns) for a long time. The chart below shows the rolling 52-week returns of the S&P 500, before dividends, since 1979.
The two financial crises in the 2000s stand out for their deeply negative returns, and contrast with the more-frequent, but shallower, bear markets of the 1980s (of course, there weren’t any bear markets in the 1990s!). The compounded nominal price return since the end of 1978 until the end of last week was 8.76%.
But that’s not how people remember returns. Normal people do not take the ending point, divide by the starting point, and raise to the power of 1/(number of years). Perception is influenced by recency. Over the past five years, if you had asked each week “what has the return of the stock market been over the last year?” the answers would have averaged 12.0%. That’s recency. Perception also weights returns by frequency of observation – and over the 38 years covered by this chart, the average rolling 12-month return has been 9.9%.
So you can understand why individual investors resist when we tell them “the long run return of stocks has been about 7%” or admonish them to be careful about current high prices. In their minds, “stocks have been rising about 10-12% per year” for nearly four decades.
Selective memory also plays a part. When we tell stories about why these events occurred, and the story doesn’t include “we started from very high prices,” we excuse them as exceptions. The bear market in the early 2000s was “the popping of the Internet bubble,” and the one in the late 2000s was “the global financial crisis caused by greedy banks.” So the mind tends to dismiss these exceptions, or weight them less. This is where the “but I will get out next time” fantasy comes in – it justifies this mental calculation. But of course, if we eliminate the “exceptions” when stocks went down, the annual returns are even more remarkable. Since 1979, the rolling 12-month return conditioned on it being positive averaged 16.6%.
These are all irrational, but they are part of perception. From a practitioner’s standpoint, these are inconvenient and the industry has worked for a long time to try and educate investors away from these perceptions since otherwise clients only want to hold stocks. But we can’t change how people think, and how they perceive market returns.
This problem has gotten worse since the early 1990s, because of the accessibility of information about market returns. The Financial News Network was launched in 1981, but it wasn’t until CNBC’s launch in 1989, combined with Chairman Greenspan’s decision to open the Fed’s kimono a few years later, that it became very easy to “check the market.” And, since perception of returns is weighted by the number of observations, more frequent observations of positive numbers has increased the expectations of investors when it comes to stock market returns. Some of the lower-quality advisors actually make the problem worse, by calling clients more often when markets are up than when they are down.
I think education is nice, and we as practitioners should of course try to convey to clients proper expectations for returns. But we can’t beat these cognitive errors; instead, what we should be trying to do is to avoid the focus on recent returns and instead present the client with their progress towards a very long-term goal (see illustration below, which is from something we’re designing), such as a particular sort of goal in retirement (“I’d like to have enough to take two major trips every year.”)
This unfortunately can lead to other games, which I will talk about this coming week, but it also allows us to manage wealth in a way that beats the outcomes offered by Modern Portfolio Theory’s focus on near-term mean-variance optimization. Now, if only we can persuade clients to do it!


