The S&P 500 High Yield Dividends Aristocrats Index
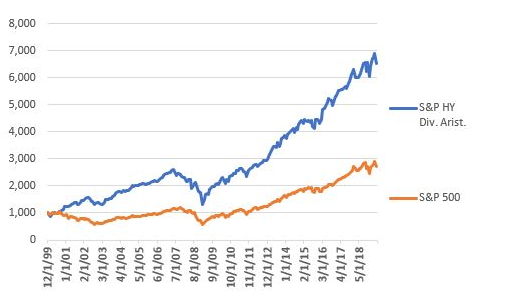
The S&P High Yield Dividend Aristocrats Index is comprised of the 50 highest dividend yielding constituents of the stocks of theS&P Composite 1500 Index that have increased dividends every year for at least 25 consecutive years. Data for the index goes back to January 2000. Figure 1 displays the theoretical growth of $1,000 invested in the index versus the growth of $1,000 invested in the S&P 500 Index starting in January 2000.

Figure 1 – Growth of $1,000 invested in the S&P High Yield Dividend Aristocrats Index and the S&P 500 Index; 12/31/1990-5/31/2019
As you can see, since inception the index has significantly outperformed the S&P 500 Index, posting a gain of +551% versus +173% for the S&P 500. Of course, you can’t trade an index, you must trade a fund or ETF that attempts to track the given index. So, we turn our attention to…
Ticker SDY
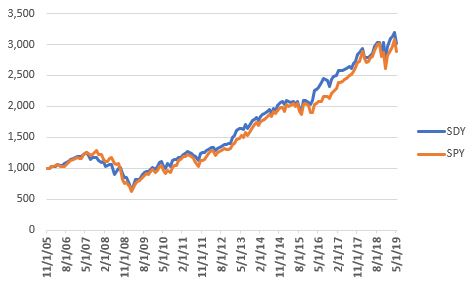
SDY is the SPDR S&P Dividend (NYSE:SDY) ETF that tracks the S&P High Yield Dividend Aristocrats Index. The first full month of trading for SDY was December 2005. So, Figure 2 displays the growth of $1,000 invested in ticker SDY starting in December 2005 versus the growth of $1,000 invested in ticker SPY – an ETF that tracks the S&P 500 Index.

Since SDY started trading it has slightly outperformed ticker SPY (+201% versus +189%). Combined with the index performance prior to SDY inception, this is pretty good all by itself.
Ticker SDYL
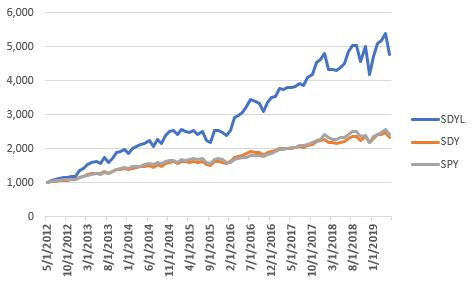
Ticker SDYL is the ETRACS Monthly Pay 2xLeveraged S&P Dividend ETN, an Exchange Traded Note linked to the monthly compounded 2x leveraged performance of the S&P High Yield Dividend Aristocrats® Index (the “Index”), reduced by the Accrued Fees. The first full month of trading for SDYL was June of 2012. Figure 3 displays the growth of $1,000 invested in SDYL, SDY and SPY since 5/31/2012.

Figure 3 – Growth of $1,000 for SDYL, SDY and SPY since 5/31/2012
Since 5/31/12:
SDYL = +418%
SDY = +143%
SPY = +148%
So does this mean SDYL is the best choice? Not necessarily. While it has made more than twice as much as the other 2 ETFs, that performance comes at the price of an average standard deviation and a maximum drawdown that is also twice as large. So, the risk factor is something to consider. But that’s not even the real problem. The real problem is that SDYL barely trades at all.
As you can see Figure 4, SDYL has failed to gain any traction with investors and holds only $16.6 million in assets and trades a paltry 1,734 shares a day. SDY trades 332 times as many shares per day as SDYL and SPY trades 42,302 times as many shares per day as SDYL.

Figure 4 – $’s in assets and average daily trading volume
Summary
For investors looking for profit potential, SDYL – at first blush looks – terrific. But will enough investors ever take notice enough for SDYL to trade with any real volume?
I don’t know.
Disclaimer: The data presented herein were obtained from various third-party sources. While I believe the data to be reliable, no representation is made as to, and no responsibility, warranty or liability is accepted for the accuracy or completeness of such information. The information, opinions and ideas expressed herein are for informational and educational purposes only and do not constitute and should not be construed as investment advice, an advertisement or offering of investment advisory services, or an offer to sell or a solicitation to buy any security.
