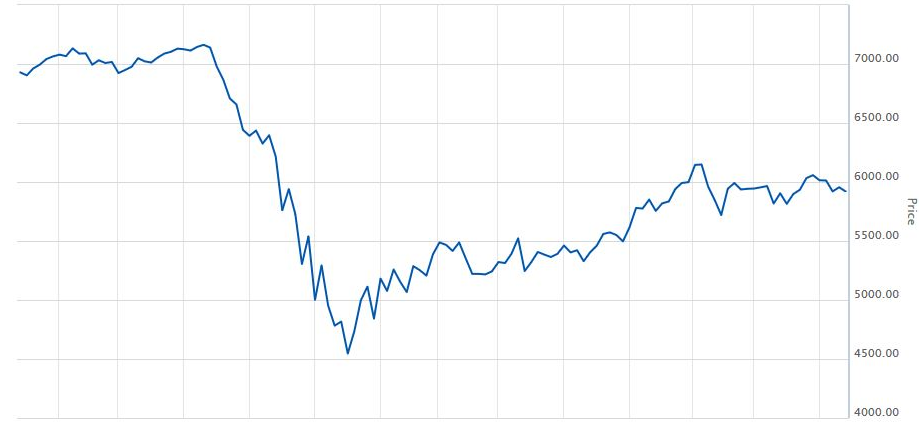
Back in March as the world markets were in the midst of the COVID-19 triggered sell-off I suggested that investors remain calm. I also suggested in my article at that time that the S&P/ASX 200 Index would not fall much below 5000 and would probably recover back up towards the long term trend. As I write today both of those guesses have proven to be correct, but that’s more a case of good luck rather than any ability to predict the future.
I based my forecast simply on the way markets have reacted in the past. In those cases generally when a significant correction takes hold those who want to take profits or need to sell because of margin loans will do so. Add to this automated trades resulting from pre-set stop-losses and trading algorithms and you have all that’s needed for a wave of selling. The market will also be dragged down since less buyers might be active and thus we end up in the same supply and demand situation as happens for other markets including real estate, fine art and cattle. I.e. a lack of buyers and an excess of sellers will tend to drive prices down.
In the 12 month chart of the ASX 200 below, we can quickly spot a few typical characteristics of a market correction. The first is the sharp sell-off or as I sometimes call it, the clean-out. This is often followed by a sharpish recovery as buyers are tempted back in as they look for oversold stocks. Also, it’s not unusual that the volume of trades decline during the correction period or phase. But buyers will only be enticed to come back into the market up to a point unless they see clear signs that the cause(s) of the sell-off have been resolved or the outlook for the economy has improved. This is why these post-correction rallies often stall and don’t recover all the ground that was lost for months or in the case of the global financial crisis (GFC), it took years.
S&P/ASX 200 Index (XJO) 1 Year Chart

Once the rally stalls the market tends to bounce around sideways as investors react to developing news (or rumors) and the short-term traders enter and exit their positions quickly. Of course, there are other factors at play and many other trading strategies exist, but I think what I have outlined is a fair simplification of what’s been happening.
The talking heads in the financial media will, of course, have all sorts of theories about why the markets are doing what they are and what will happen next, but here’s an insight – we have no idea how the markets will fare over the next 6 months because central banks and governments have no control over a virus. They can pump stimulus into economies, keep interest rates low and do the usual tricks to try and cover over problems, but none of this will stop the spread of COVID-19. If lockdowns, travel restrictions and limited trading hours, etc. remain across most G-20 countries then the global economy will slide into a recession. If that happens, then there’s nothing to be bullish about this year.
For now, it appears that the Australian stock market (ASX 200) is in a holding pattern at around the 6000 level (see chart below) after recovering from a low near 4500. I can’t however think of many reasons in the short term why the ASX 200 would surge towards 7000, but I can certainly think of plenty why it might fall back towards 5000. So in market terms, this basically means I believe the downside risks are greater than the upside ones. But this could change very quickly and I’m sure we will see quite a few significant swings during the next few months.
S&P/ASX 200 Index (XJO) 6 Month Chart

So at this stage, we are dealing with uncertainty and this uncertainty is more related to the hard sciences and less to do with the social sciences including economics. Certainly, economics plays a role, but probably the next major move will be triggered by news that either the worst of the COVID-19 pandemic is behind us or a promising vaccine has been identified – or both. For now though, I’m just as clueless as everyone else in regards to what the markets will do for the next couple of months.
