The All New Market Analysis

Published 12/17/2020, 12:48 AM
Updated 07/09/2023, 06:31 AM
US500
-
GLD
-
GDX
-
GDXJ
-

SPX Monitoring purposes; Long SPX 12/14/20 at 3647.49.

Monitoring purposes GOLD: Long GDX on 10/9/20 at 40.78.

Long Term SPX monitor purposes; Long SPX on 10/26/20 at 3400.97.
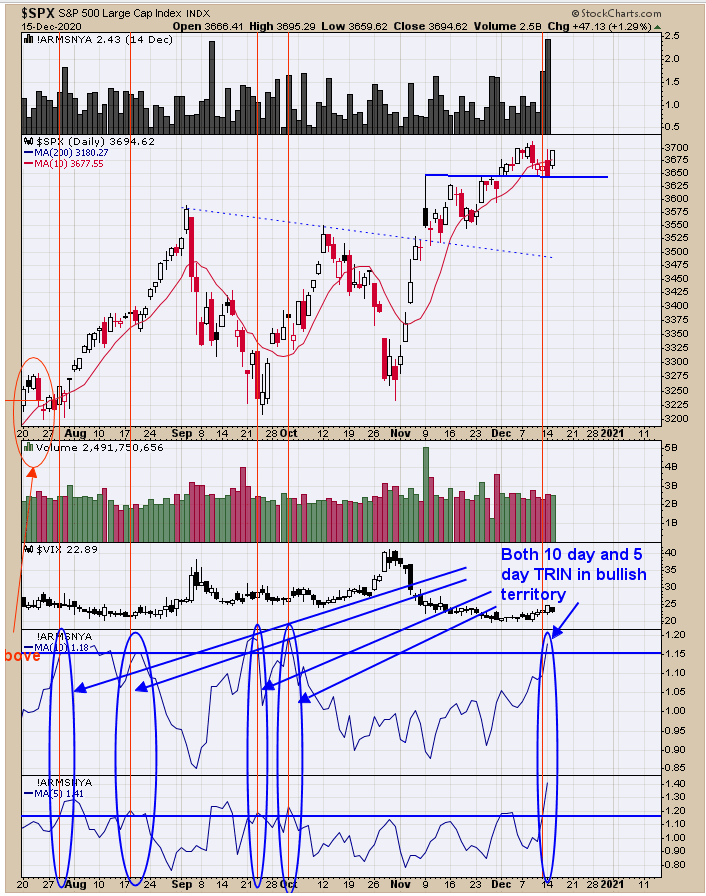
SPX Daily Chart.

It’s a bullish longer term sign when the 5 and 10 day TRIN reach bullish levels in the same time. The bottom window is the 5 day average of the TRIN and next window up is the 10 day average. When both are in the bullish level (Circled in blue and with red vertical lines) the rallies last longer. This evidence suggests the rally could last into year end if not longer. Long SPX on 12/14/20 at 3647.49. 
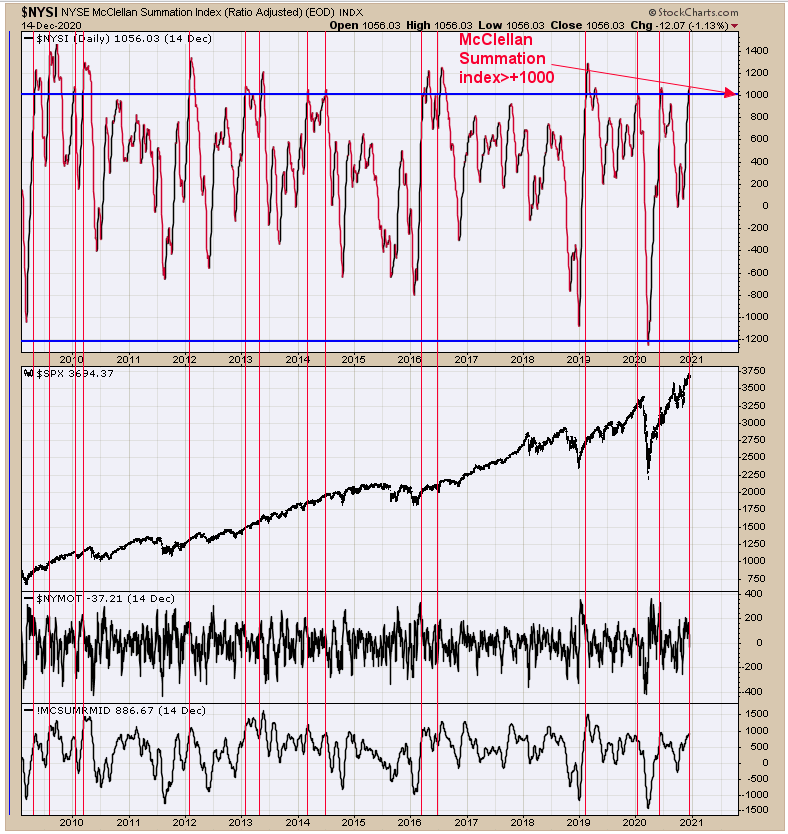
NYSI Daily Chart

Above is another view of the intermediate term for the market. The current NYSE McClellan Summation index reading is +1056. We went back to 2009 and showed the times when the NYSE McClellan Summation index closed above +1000 (noted with red vertical lines) and in most all cases the market at least marched higher for several weeks (some cases a lot longer). Our point is the next several weeks look good. Markets weaken first before a top is near and so far no weakness is showing up.  Sentiment is terrible but momentum rules all and right now the momentum is up.
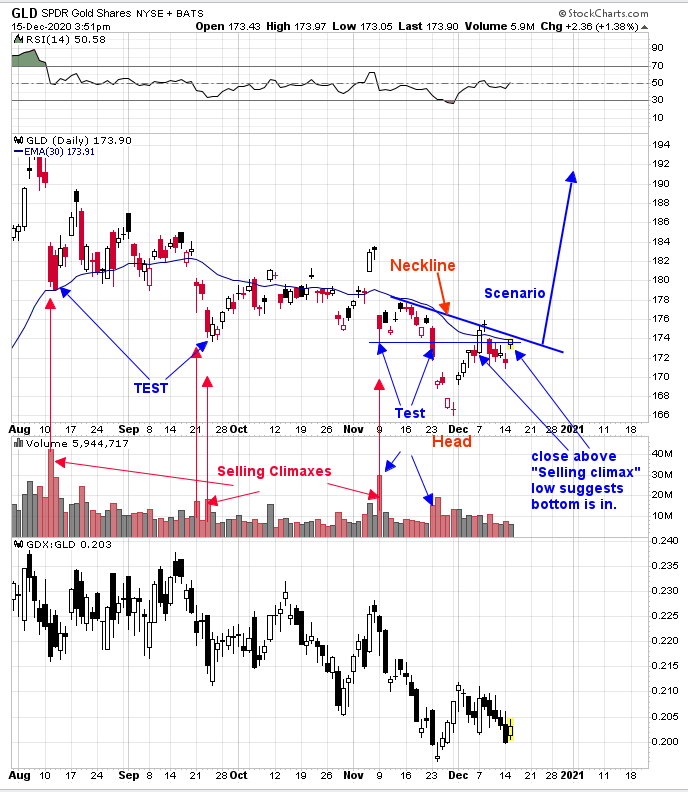
GLD Daily Chart

We have shown this chart is the past which is the daily GLD. A “Selling Climax” occurred on 11/9 and the test came on 11/23; but the test needs to close above the “Selling Climax” low for a bullish signal.  A close above the “Selling Climax” low did come on 11/23 but failed to hold above. Today GLD (NYSE:GLD) is back at the low of the “Selling Climax” but not giving a clear signal, at least for today. The pattern forming since November could be a “Head and Shoulders bottom” where the “Head” is the November 30 low; the “Right Shoulder” is being completed now. There is a cycle low due around 12/23 and the gold market could meander around tell then. Our view is that this is a good place to be long Gold stocks including (GDXJ) and GDX.  Silver on the next ally phase should outperform Gold. Long GDX on 10/9/20 at 40.78.

Latest comments

Loading next article…
Risk Disclosure: Trading in financial instruments and/or cryptocurrencies involves high risks including the risk of losing some, or all, of your investment amount, and may not be suitable for all investors. Prices of cryptocurrencies are extremely volatile and may be affected by external factors such as financial, regulatory or political events. Trading on margin increases the financial risks.
Before deciding to trade in financial instrument or cryptocurrencies you should be fully informed of the risks and costs associated with trading the financial markets, carefully consider your investment objectives, level of experience, and risk appetite, and seek professional advice where needed.
Fusion Media would like to remind you that the data contained in this website is not necessarily real-time nor accurate. The data and prices on the website are not necessarily provided by any market or exchange, but may be provided by market makers, and so prices may not be accurate and may differ from the actual price at any given market, meaning prices are indicative and not appropriate for trading purposes. Fusion Media and any provider of the data contained in this website will not accept liability for any loss or damage as a result of your trading, or your reliance on the information contained within this website.
It is prohibited to use, store, reproduce, display, modify, transmit or distribute the data contained in this website without the explicit prior written permission of Fusion Media and/or the data provider. All intellectual property rights are reserved by the providers and/or the exchange providing the data contained in this website.
Fusion Media may be compensated by the advertisers that appear on the website, based on your interaction with the advertisements or advertisers.
© 2007-2025 - Fusion Media Limited. All Rights Reserved.