We’ve already shown you how The Panic of 1907 had very distinct Elliott Wave characteristics. It was a natural correction in the wave cycle, following a complete five-wave impulse pattern.
Today, we’re going to examine another well-known calamity, which occurred just over a century later – The Financial Crisis of 2008.
Chances are you know the story quite well by now. Low interest rates fueled a gigantic housing bubble, built on mountains of unsustainable debt. The bubble’s inevitable burst dragged the entire economy to its knees.
Large financial institutions went bankrupt, were acquired by competitors or had to be rescued by the state in order to avoid the collapse of the entire financial system.
Money printing, also known as quantitative easing and fiscal stimulus, barely managed to help the economy avoid depression.
After a 58% crash, the stock market as measured by the S&P 500, finally stopped falling in March 2009. What followed was the longest economic expansion in history, which, excluding the deep but brief Covid-19 recession of 2020, continues to this day.
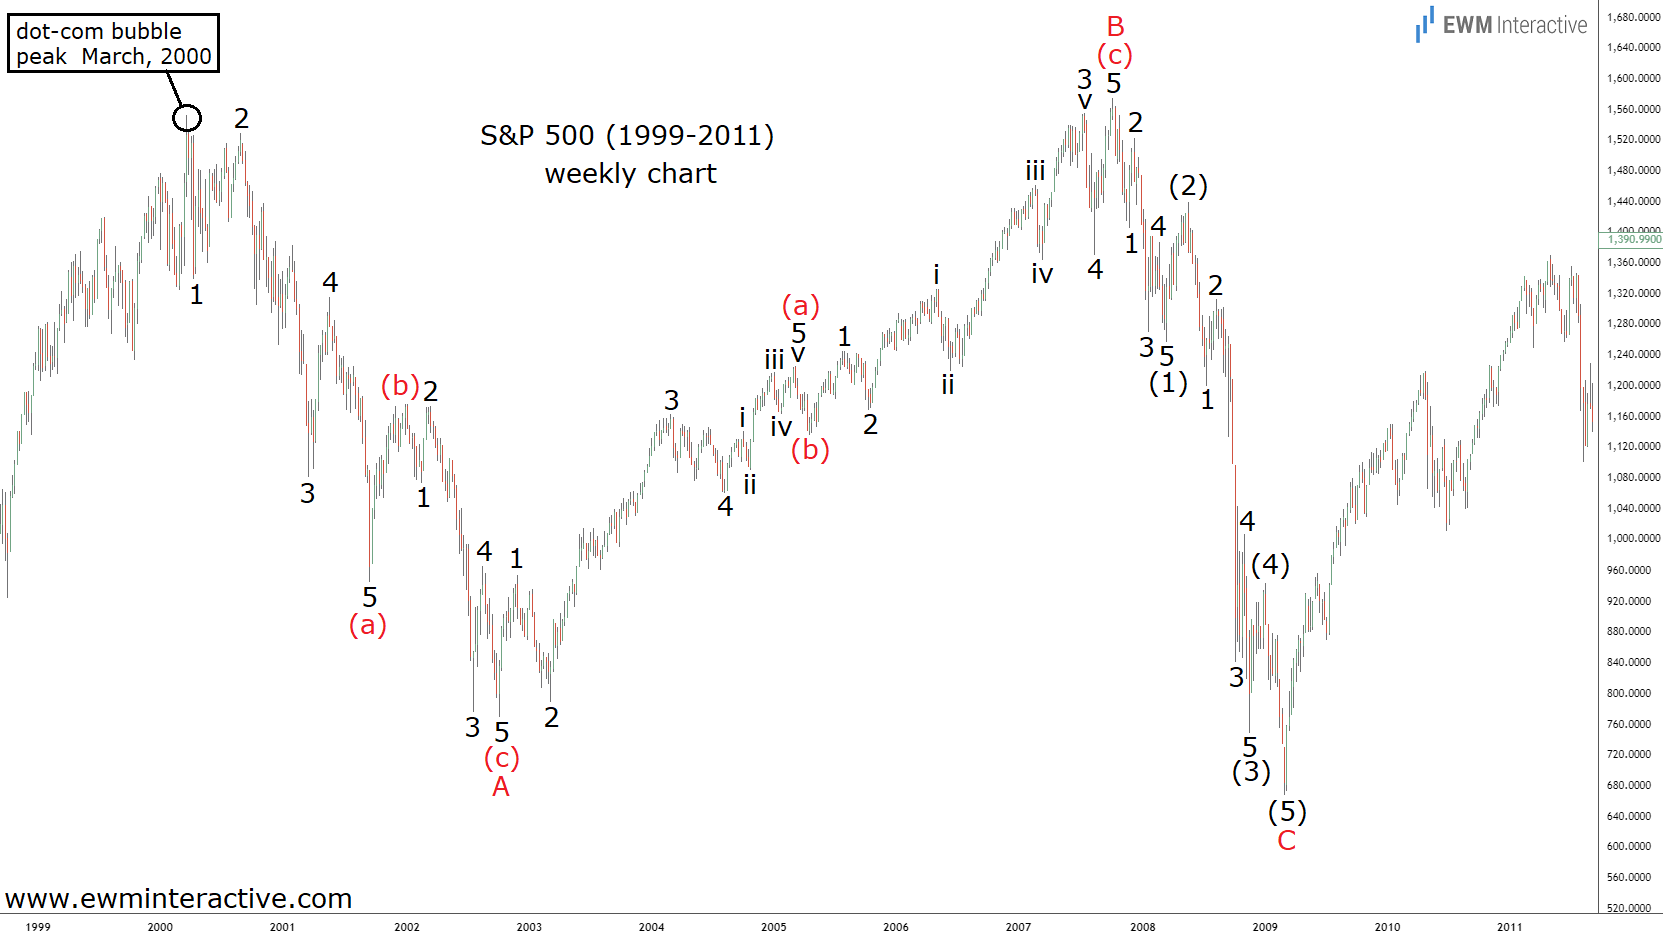
But what if we told you that the seeds of the 2008 disaster were planted much earlier? As the chart below will show, the collapse of the Dot-com bubble in 2000 was the real beginning of the market correction, which later culminated in the 2008 Financial Crisis.
These two meltdowns, along with the bull market in between, formed a textbook Elliott Wave pattern known as an expanding flat correction.

An expanding flat consists of three waves, marked A-B-C, where waves A and B have three-wave structures, while wave C is a five-wave impulse pattern. Wave B exceeds the starting point of wave A, while wave C breaches the end of it.
The correction began with the burst of the Dot-com bubble in March 2000. In October 2002, the S&P 500 reached a bottom of 769, down 50.4% from its all-time high.
As visible, that bear market took the shape of a simple (a)-(b)-(c) zigzag correction, where waves (a) and (c) were clear impulses, marked 1-2-3-4-5. Nobody could’ve known it then, but the 2000-2002 decline was only the first wave – A – of a much bigger corrective pattern.
During the 2002-2007 bull market, the housing bubble really took on a life of its own. Literally, anyone who could maintain a pulse could qualify for a mortgage loan.
People with no jobs and no incomes found themselves with several houses, while the banks originating those loans simply securitized and sold them on the market, transferring the risk to unsuspecting investors. The credit agencies blessed the bad loans with triple-A ratings for fear of losing the big banks as clients.
The S&P 500 index recouped all the losses it suffered in the aftermath of the Dot-com bubble, but just barely. Wave B, as that bull run is now labeled on the chart above, was another (a)-(b)-(c) zigzag correction.
The five-wave structure of waves (a) and (c) is visible again. We can even see the five sub-waves of 5 of (a) and 3 of (c). Alas, not long after the market made a new all-time high at 1576 in October 2007, the music stopped again.
Everything that happened during the 2008-9 Financial Crisis, all the bad loans, the surging unemployment, the blame game between financial institutions, regulators and the government, all the bankruptcies, the rescue packages and forced mergers eventually produced a textbook impulse pattern, labeled (1)-(2)-(3)-(4)-(5) in wave C. The five sub-waves of wave (3) are visible, as well.
Together, the dot-com crash, the housing bubble and its undoing formed a complete expanding flat correction spanning nine years between March 2000 and March 2009. They were not separate developments.
In much the same way, the COVID-19 panic and the 2022 bear market cannot be understood properly in isolation. They, too, are phases of a larger Elliott Wave pattern and parts of bigger whole.
According to the Elliott Wave principle, once a correction is over, the preceding trend resumes. In this respect, the post-2009 bull market is not a surprise. It began from the bottom of a complete expanding flat correction.
Over the following 15 years, it formed another clear pattern of its own. What’s left of it and what happens after it is over? That’s the subject of discussion in our Elliott Wave PRO analysis of the S&P 500.
