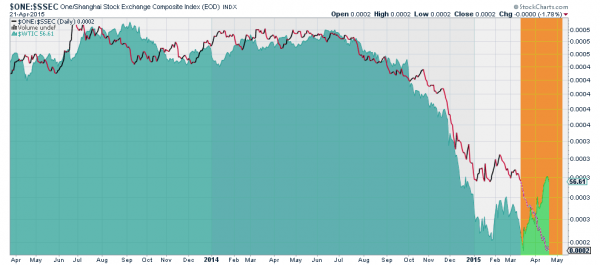
About a month ago in this space I noted the relationship between the Chinese market and the price of West Texas Intermediate crude oil. At that point it was clear that the the two assets moved in tandem and had done so for over 2 years. Correlations like this are useful to traders, until they change. So a month on, what does this relationship look like?

Pretty interesting right? Almost as soon as you read the the last article the relations started to change. The orange box delineates that timeline. Remember that the Shanghai Composite is shown inverted here. As the price of crude oil was falling and the Shanghai Composite rising, suddenly the price of crude oil reversed and started back higher. Not only has the old correlation broken down, but the price action since mid March shows a perfectly negative correlation on this chart. Or a perfect correlation between crude and Chinese prices, with both rising. At times when a correlation changes there can be volatility and opportunity. Keep an eye on this pair.
The information in this blog post represents my own opinions and does not contain a recommendation for any particular security or investment. I or my affiliates may hold positions or other interests in securities mentioned in the Blog, please see my Disclaimer page for my full disclaimer.
