
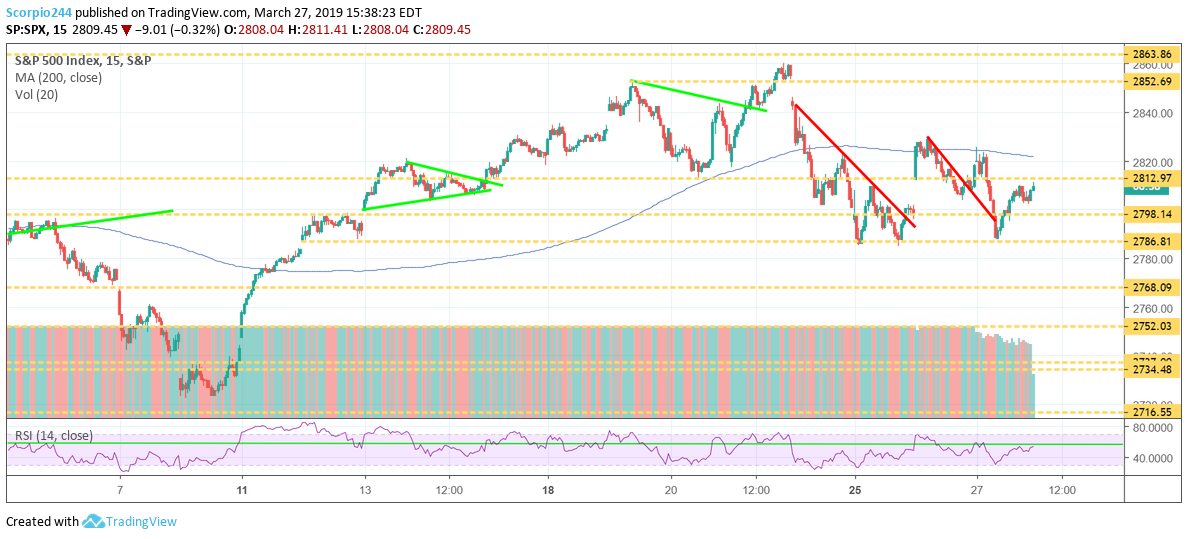
S&P 500 (SPY)
The S&P 500 had a hard day, but if you watched things closely enough, you can’t help but think this is a stock market that wants to go higher. The S&P 500 has been battling support at 2,786 over the past few days, and today was no different. Support has now held at this level 3 time, a triple bottom, a bullish reversal pattern, suggesting the market rises. Again, I think this market climbs to 2,850 to 2,860 region.
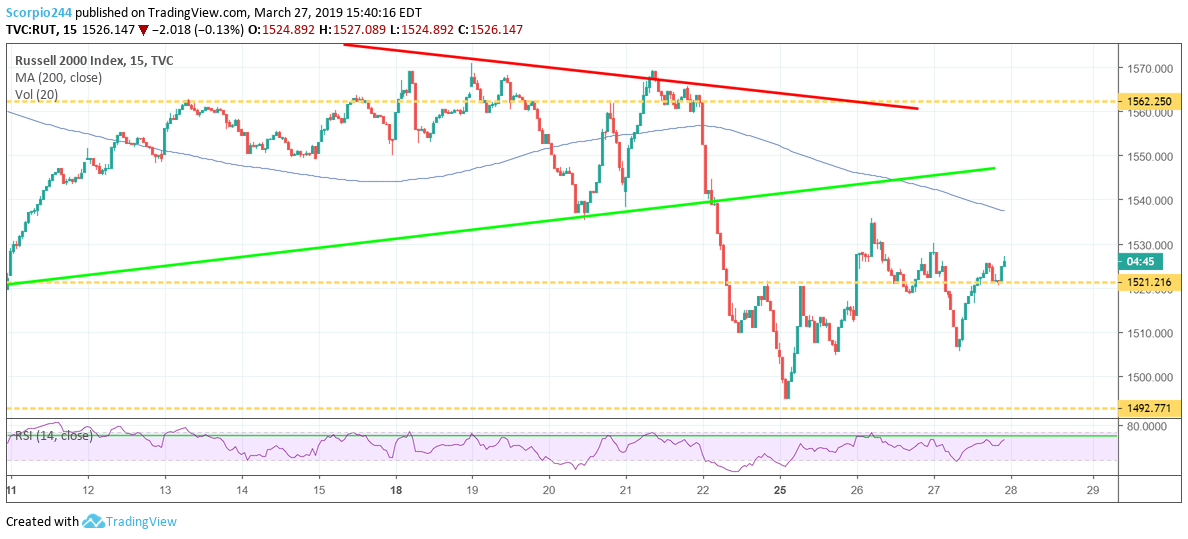
Russell 2000
The Russell 2000 has also been struggling recently with 1,521 being the important battleground region. The chart shows that the bears tried hard to crack the Russell today, not only did the bulls hold strong, but they also retook 1,521, holding it for the balance of the day.
Rates
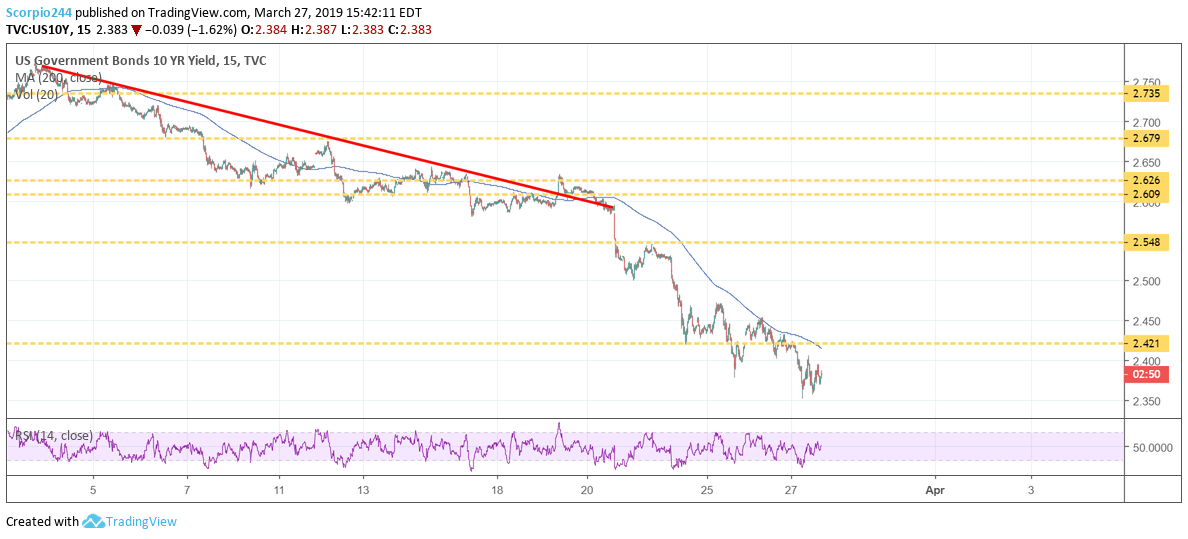
One reason for the market’s turbulence is that yields continue to fall, reaching a low of 2.35% on the 10-year. Who in their right mind would have ever thought yields would sink this low? I did.
Going Lower?
I will make another prediction; rates may be heading even lower. The chart below really shows it. After hitting levels not seen since 1988, the spread for the US 10-Year and the German 10-Year is now contracting.
If you look closely, you can see that head and shoulder forming in the spread, a bearish pattern, and it would suggest that the spreads contracts even further by another 20 basis points to 2.25% between the US and German rates.
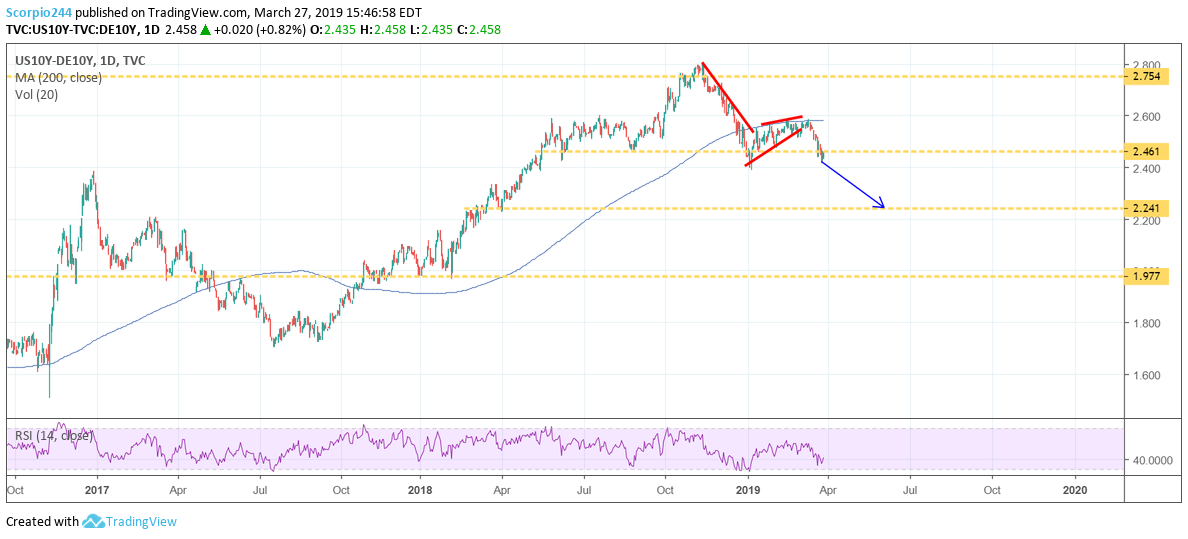
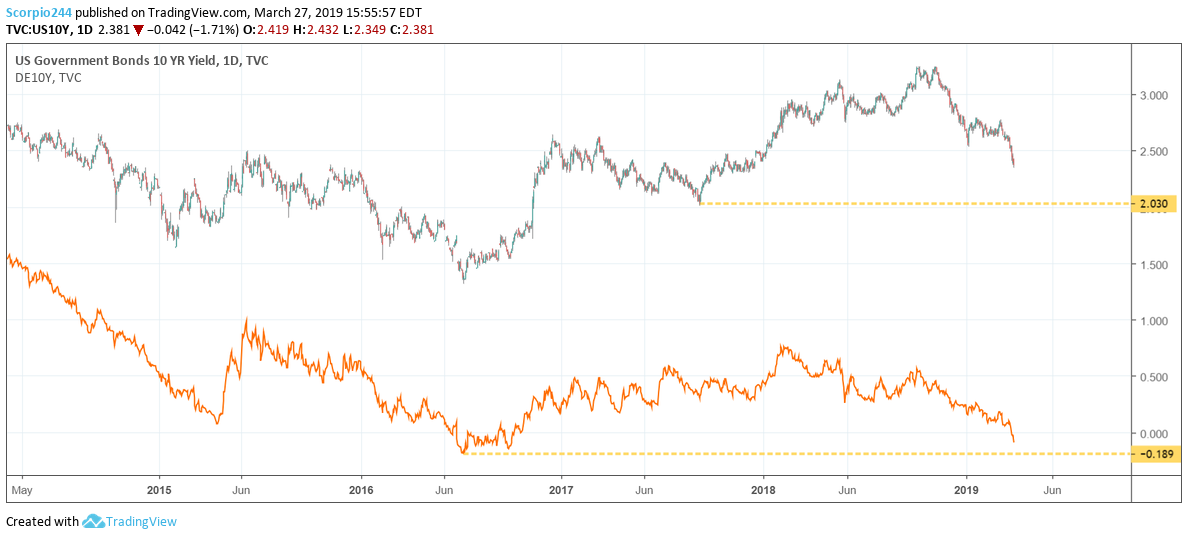
And this next chart suggests the Bunds could fall to -0.19% and the 10-Year fall to 2.03%, which would give us our spread of 2.2%, pretty close to that 2.25% the chart for the spread is showing above.
Wait, What?
So you might ask, how can I be bullish on stocks and see the S&P 500 rising to 3,000 with the signs of doom yields are sending?
I am bullish on stocks, and that is because I am not interpreting yields the same way as most. Yields represent expectations for future inflation rates, not future GDP growth rates. The velocity of MZM seems pretty clear to me that there is no inflation in the economy. Just look at that correlation between yields and the MZM velocity. Simply put, in the 1980s $1 created in MZM created about $3.5 in GDP. Today, that same dollar in MZM creates only $1.3 in GDP. $1 created today does not possess the same inflationary power it did at one time.

Simple Math
The velocity of money is merely a ratio, (nominal GDP/ MZM money supply). With all the money printing in recent years and slow GDP growth, inflation just hasn’t been able to see a spark. As long as the money supply keeps being printed at a pace faster than the GDP can rise, velocity will continue to fall, and hence we get no inflation and lower rates. It is just a simple ratio, coupled with a nearly 60-year correlation between the velocity of MZM and yields. Make sense?
