
Terex Corporation’s (NYSE:TEX) third-quarter 2017 adjusted earnings surged a whopping 194% year over year to 50 cents per share. Earnings also beat the Zacks Consensus Estimate of 36 cents per share by a wide margin of 39%. All the three segments increased sales, improved operating margin and grew backlog which led to the overall improved performance in the quarter.
Including one-time items, Terex posted earnings of 63 cents per share in the quarter compared to 31 cents reported in the year-ago quarter.
Operational Update
Revenues in the quarter improved 5% year over year to $1,111 million from $1,056 million recorded in the prior-year quarter. Revenues beat the Zacks Consensus Estimate of $1,034 million.
Cost of goods sold increased 2.3% to $892 million from $873 million in the prior-year quarter. Gross profit surged 19% year over year to $219 million. Gross margin expanded 230 basis points (bps) to 19.7%.
Terex Corporation Price, Consensus and EPS Surprise
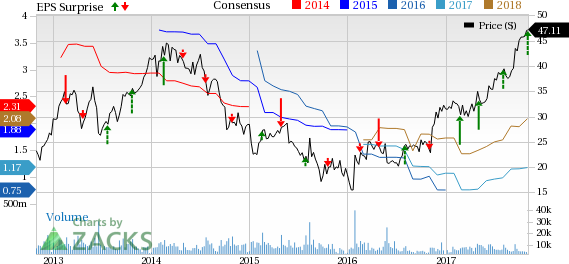
Terex Corporation Price, Consensus and EPS Surprise | Terex Corporation Quote
Selling, general and administrative expenses increased 7% year over year to $154.8 million. Terex reported an operating income of $64.2 million compared with $39.6 million in the year-ago quarter, a rise of 62%. Operating margin expanded 210 bps to 5.8%.
Segment Performance
The Aerial Work Platforms (AWP) segment posted revenues of $556.7 million in the quarter, up 15% from $484.4 million in the prior-year quarter. Operating income improved 18% to $57.5 million from $48.6 million in the prior-year quarter.
Revenues from the Crane segment were up 7% to $301.9 million from $282.8 million recorded in the year-ago quarter. The segment reported an operating loss of $1.3 million, narrower than the operating loss of $12.1 million in the prior-year quarter.
The Material Processing (MP) segment’s revenues were $259.9 million, up 14% year over year. The segment reported an operating income of $28.4 million, up 46% year over year.
Financial Position
Terex had cash and cash equivalents of $592.7 million at the end of third-quarter 2017 compared with $428.5 million at the end of 2016. The company used $56.2 million of cash in operations in the nine-month period ended Sep 30, 2017 compared with cash inflow of $100.3 million in the prior-year comparable period. Long-term debt was $980 million as of Sep 30, 2017, compared with $1.56 billion as of Dec 31, 2016.
During the reported quarter, Terex repurchased 6.4 million of its shares for $254 million. This brings the total to 22.3 million shares repurchased for $770 million for the first nine months of the year. Terex sold remaining holdings of Konecranes shares for proceeds of $221 million, bringing the total consideration received by the company for the disposition of Material Handling & Port Solutions (MHPS) to approximately $1.6 billion.
2017 Guidance
Given its year-to-date results, positive market dynamics, operational expectations for the fourth quarter, Terex has raised full-year adjusted EPS guidance to $1.20-$1.30 from the previous guidance range of $1.05-$1.15.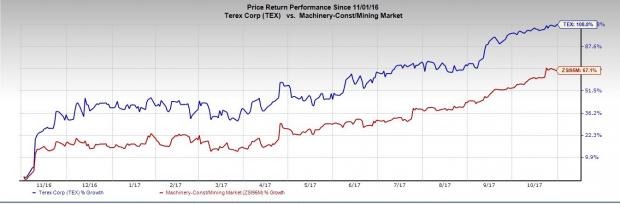
The company continues to implement its strategy to focus and simplify the company, and build capabilities in key commercial and operational areas. Its on-going efforts to expand capabilities in sales execution and account management through Commercial Excellence initiative reflects the company’s growing bookings and backlog. Consequently, Terex has, soared 108.8% in the past year, outperforming 67.1% growth recorded by the industry.
Terex currently carries a Zacks Rank #2 (Buy).
Other Stocks to Consider
Other top-ranked stocks worth considering in the same sector are Lakeland Industries, Inc. (NASDAQ:LAKE) , China National Materials Company Limited (OTC:CASDY) and Caterpillar Inc. (NYSE:CAT) . All three stocks flaunt a Zacks Rank of 1 (Strong Buy). You can see the complete list of today’s Zacks #1 Rank stocks here.
Lakeland Industries has an expected long-term earnings growth rate of 10%.
China National Materials has an expected long-term earnings growth rate of 20%.
Caterpillar has an expected long-term earnings growth rate of 9.5%.
More Stock News: This Is Bigger than the iPhone!
It could become the mother of all technological revolutions. Apple (NASDAQ:AAPL) sold a mere 1 billion iPhones in 10 years but a new breakthrough is expected to generate more than 27 billion devices in just 3 years, creating a $1.7 trillion market.
Zacks has just released a Special Report that spotlights this fast-emerging phenomenon and 6 tickers for taking advantage of it. If you don't buy now, you may kick yourself in 2020. Click here for the 6 trades >>
Terex Corporation (TEX): Free Stock Analysis Report
Caterpillar, Inc. (CAT): Free Stock Analysis Report
Lakeland Industries, Inc. (LAKE): Free Stock Analysis Report
China National Materials Group Corp. (CASDY): Free Stock Analysis Report
Original post