- Monitoring purposes: Flat
- Monitoring purposes Gold: Short VanEck Vectors Gold Miners (NYSE:GDX) 11/2/16 at 24.78.
- Long-Term Trend monitor purposes: Short SPX on 1/13/16 at 1890.28

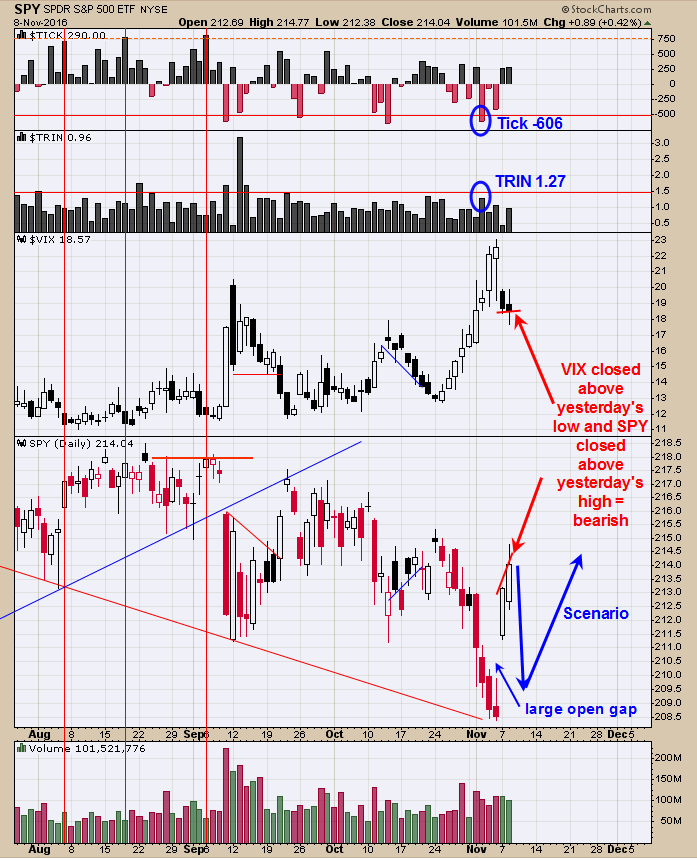
Yesterday’s we said, “On November 2 the TRIN closed at 1.27 and the TICK closed at -606 which is a bullish combination. Ideally one would like to see more panic in the TRIN close above 1.50 to suggest a longer term bottom as the higher panic in the TRIN and TICK closes produce stronger bottoms in the market.” Therefore the TRIN and TICK closes of 11/2/16 suggests just a mild bullish condition. In general the VIX trades opposite of the SPDR S&P 500 (NYSE:SPY) and also usually leads the way for the SPY. Today the VIX closed above yesterday’s low and the SPY closed above yesterday’s high which is a bearish divergence suggesting SPY may pull back short term. Also a large gap opening occurred Monday and the larger the gap the more likely it will get filled sooner rather then later. Also probability studies show market is usually up going into election and down up to five days after. Expecting a pull back to test gap near 210 range and a possible bullish setup. (Timer Digest has moved up The Ord Oracle (NYSE:ORCL) to 7Th in nation on performance the last 12 months on SPX.)

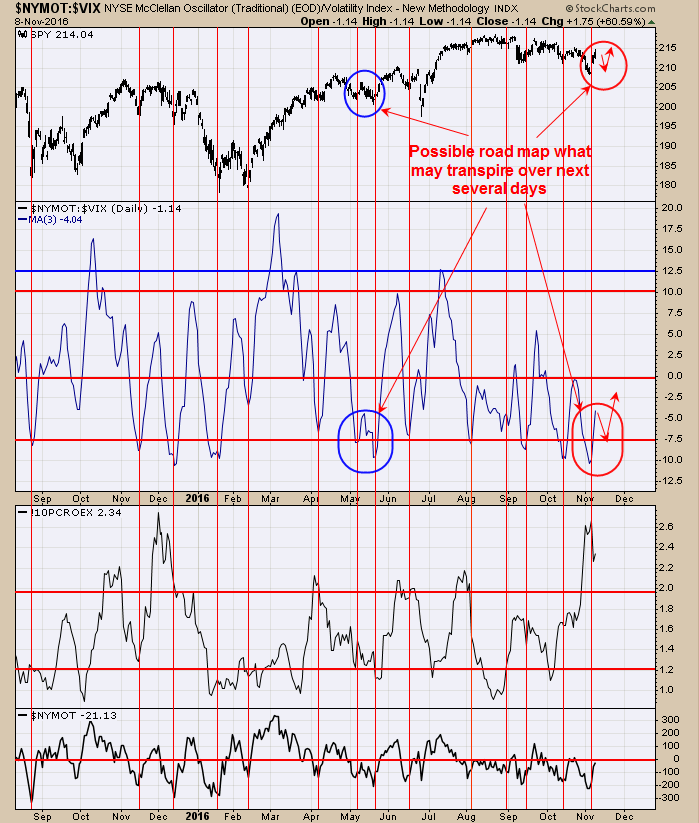
The middle window is the McClellan Oscillator/VIX ratio. When this ratio trades below -7.5 a bottom is usually not far off. This ratio traded below -10 Last Friday. What may transpire in the coming days may look similar to the March period where the McClellan Oscillator/VIX ratio had a double dip before heading higher. With the probabilities favor a pull back after the election and a large open gap below current prices, a pull back to fill gap near 210 on the SPY is possible.

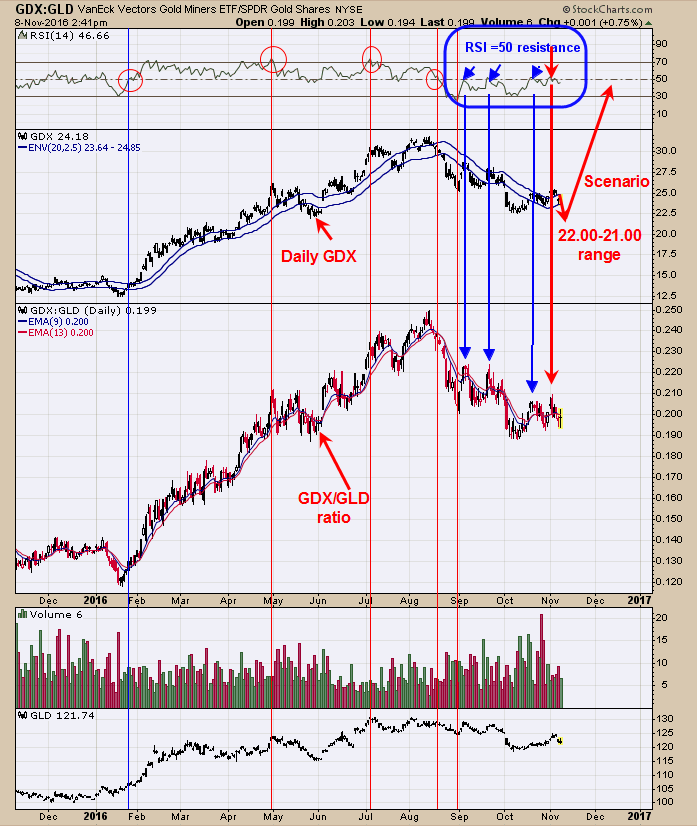
In general when the daily RSI of the GDX/GLD ratio stays below 50; GDX is considered in a downtrend and when above 50, an uptrend. When the RSI of the GDX/GLD ratio finds resistance near 50 and turns down (like now) then a short term pull back in GDX is probable. The RSI of the GDX/GLD ratio bounce against the 50 range late last week suggesting GDX was at resistance. Since then, GDX has pulled back some. As of now there is still a possibility GDX may test the 22.00 to 21.00 range before the next uptrend starts. Once the next low is found, the next major impulse wave up should break to new highs. Short GDX on 11/2/16 at 24.78.
